| Red | Green | Blue | |
| z | 17.64 | ||
| znorm | Inf | ||
| sky | -Inf | -Inf | -NaN |
| S/N | 30.9 | 50.2 | 55.4 |
| S/N(c) | 0.0 | 0.0 | 0.0 |
| SN(E/C) |
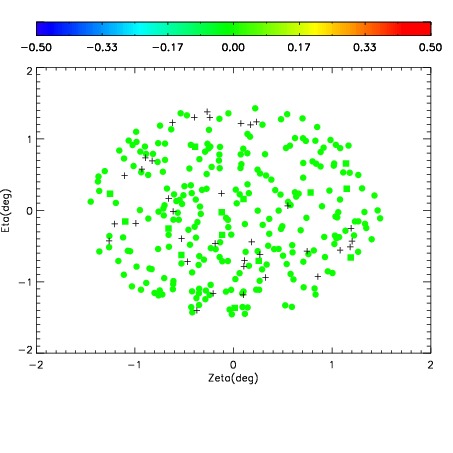
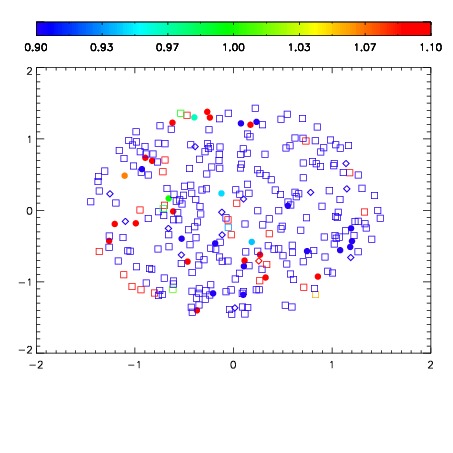


| Frame | Nreads | Zeropoints | Mag plots | Spatial mag deviation | Spatial sky 16325A emission deviations (filled: sky, open: star) | Spatial sky continuum emission | Spatial sky telluric CO2 absorption deviations (filled: H < 10) | |||||||||||||||||||||||
| 0 | 0 |
|
|
|
|
|
|
| IPAIR | NAME | SHIFT | NEWSHIFT | S/N | NAME | SHIFT | NEWSHIFT | S/N |
| 0 | 17840024 | 0.512618 | 0.00000 | 19.1670 | 17840026 | 0.00111580 | 0.511502 | 19.1553 |
| 1 | 17840023 | 0.511640 | 0.000977993 | 19.1455 | 17840029 | 0.00128673 | 0.511331 | 19.1531 |
| 2 | 17840028 | 0.510814 | 0.00180399 | 19.1454 | 17840025 | 0.00118673 | 0.511431 | 19.1527 |
| 3 | 17840027 | 0.511620 | 0.000998020 | 19.1229 | 17840022 | 0.00000 | 0.512618 | 19.1180 |