| Red | Green | Blue | |
| z | 17.64 | ||
| znorm | Inf | ||
| sky | -Inf | -NaN | -NaN |
| S/N | 26.0 | 44.0 | 50.7 |
| S/N(c) | 0.0 | 0.0 | 0.0 |
| SN(E/C) |
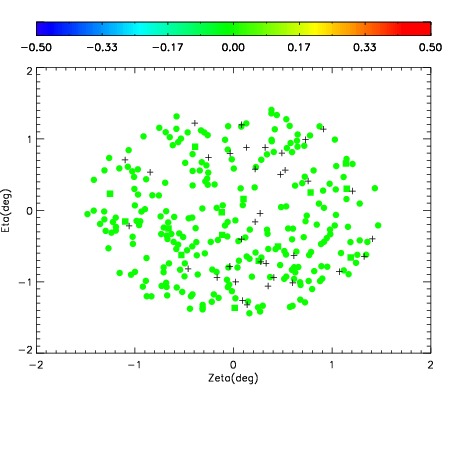
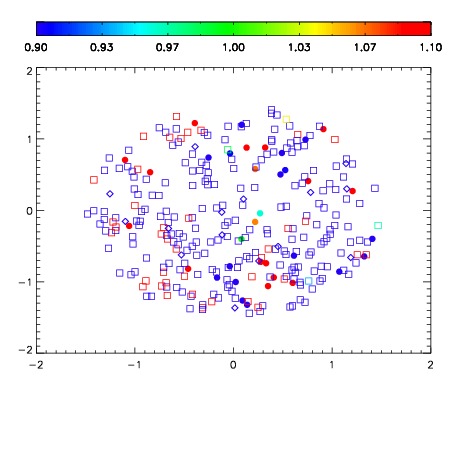
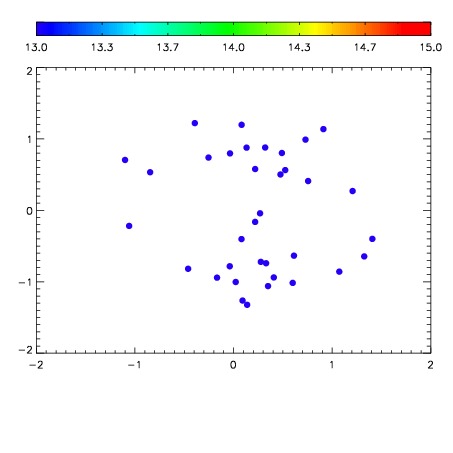

| Frame | Nreads | Zeropoints | Mag plots | Spatial mag deviation | Spatial sky 16325A emission deviations (filled: sky, open: star) | Spatial sky continuum emission | Spatial sky telluric CO2 absorption deviations (filled: H < 10) | |||||||||||||||||||||||
| 0 | 0 |
|
|
|
|
|
|
| IPAIR | NAME | SHIFT | NEWSHIFT | S/N | NAME | SHIFT | NEWSHIFT | S/N |
| 0 | 17660031 | 0.508360 | 0.00000 | 19.0027 | 17660032 | 0.00387801 | 0.504482 | 18.9997 |
| 1 | 17660030 | 0.508043 | 0.000317037 | 19.0475 | 17660029 | 0.00296627 | 0.505394 | 19.0533 |
| 2 | 17660026 | 0.507540 | 0.000820041 | 19.0352 | 17660025 | 0.00000 | 0.508360 | 19.0477 |
| 3 | 17660027 | 0.508281 | 7.90358e-05 | 19.0105 | 17660028 | 0.00312493 | 0.505235 | 19.0413 |