| Red | Green | Blue | |
| z | 17.64 | ||
| znorm | Inf | ||
| sky | -Inf | -Inf | -Inf |
| S/N | 27.4 | 45.2 | 52.2 |
| S/N(c) | 0.0 | 0.0 | 0.0 |
| SN(E/C) |
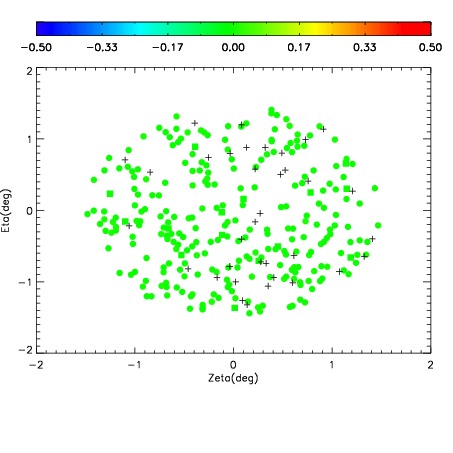
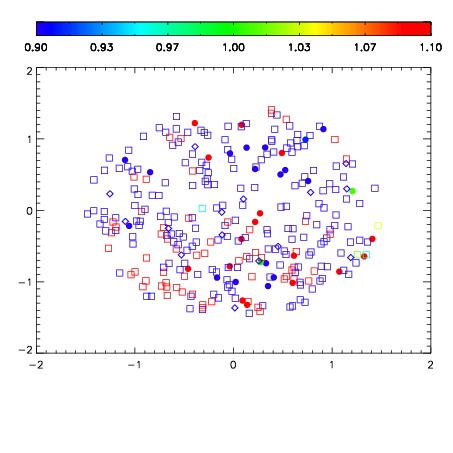
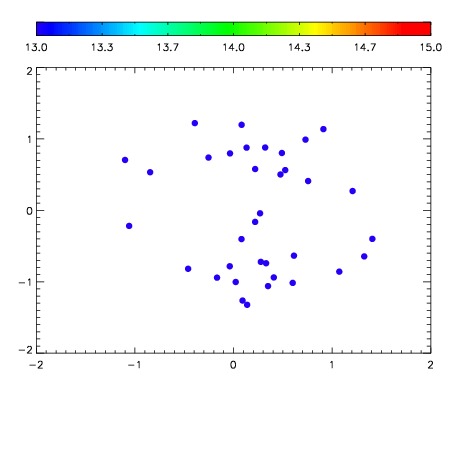

| Frame | Nreads | Zeropoints | Mag plots | Spatial mag deviation | Spatial sky 16325A emission deviations (filled: sky, open: star) | Spatial sky continuum emission | Spatial sky telluric CO2 absorption deviations (filled: H < 10) | |||||||||||||||||||||||
| 0 | 0 |
|
|
|
|
|
|
| IPAIR | NAME | SHIFT | NEWSHIFT | S/N | NAME | SHIFT | NEWSHIFT | S/N |
| 0 | 17850042 | 0.519237 | 0.00000 | 18.9335 | 17850041 | 0.00273641 | 0.516501 | 18.8411 |
| 1 | 17850043 | 0.518929 | 0.000307977 | 19.0852 | 17850040 | 0.00295691 | 0.516280 | 19.0798 |
| 2 | 17850038 | 0.517013 | 0.00222397 | 19.0613 | 17850044 | 0.00261922 | 0.516618 | 19.0521 |
| 3 | 17850039 | 0.517208 | 0.00202900 | 19.0446 | 17850037 | 0.00000 | 0.519237 | 19.0447 |