| Red | Green | Blue | |
| z | 17.64 | ||
| znorm | Inf | ||
| sky | -Inf | -Inf | -NaN |
| S/N | 28.7 | 49.0 | 55.5 |
| S/N(c) | 0.0 | 0.0 | 0.0 |
| SN(E/C) |
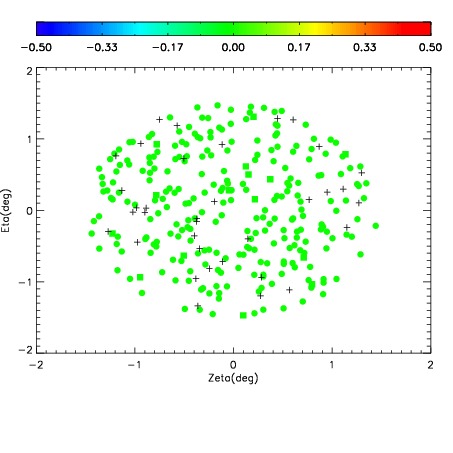
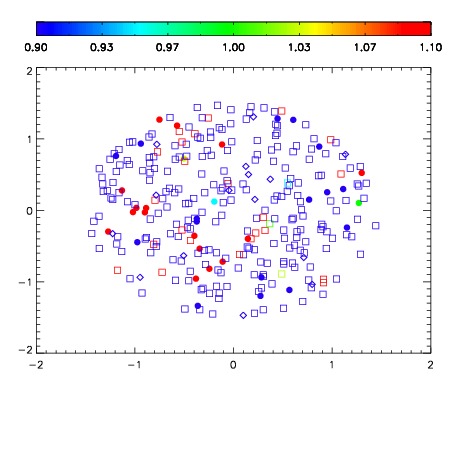
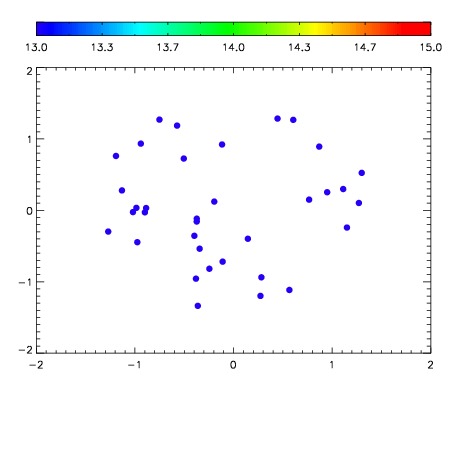

| Frame | Nreads | Zeropoints | Mag plots | Spatial mag deviation | Spatial sky 16325A emission deviations (filled: sky, open: star) | Spatial sky continuum emission | Spatial sky telluric CO2 absorption deviations (filled: H < 10) | |||||||||||||||||||||||
| 0 | 0 |
|
|
|
|
|
|
| IPAIR | NAME | SHIFT | NEWSHIFT | S/N | NAME | SHIFT | NEWSHIFT | S/N |
| 0 | 17860024 | 0.516060 | 0.00000 | 19.1922 | 17860026 | 0.000504463 | 0.515556 | 19.1841 |
| 1 | 17860023 | 0.515923 | 0.000136971 | 19.1976 | 17860025 | 0.000843628 | 0.515216 | 19.1923 |
| 2 | 17860027 | 0.514914 | 0.00114602 | 19.1673 | 17860022 | 0.00000 | 0.516060 | 19.1496 |
| 3 | 17860028 | 0.515493 | 0.000567019 | 19.0822 | 17860029 | 0.00264813 | 0.513412 | 19.0796 |