| Red | Green | Blue | |
| z | 17.64 | ||
| znorm | Inf | ||
| sky | -Inf | -Inf | -NaN |
| S/N | 18.4 | 32.0 | 37.4 |
| S/N(c) | 0.0 | 0.0 | 0.0 |
| SN(E/C) |
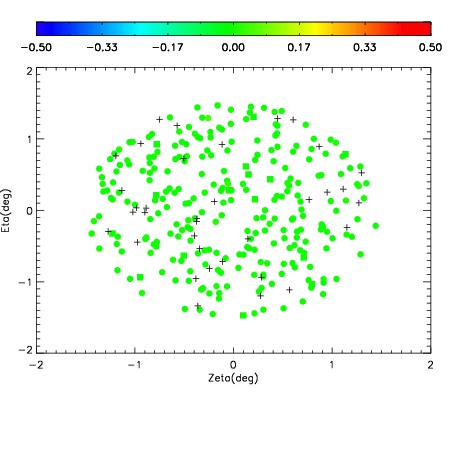
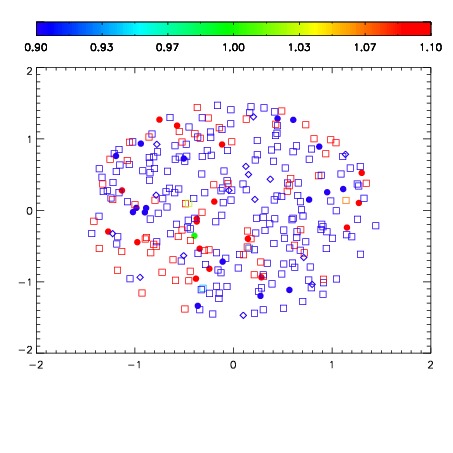
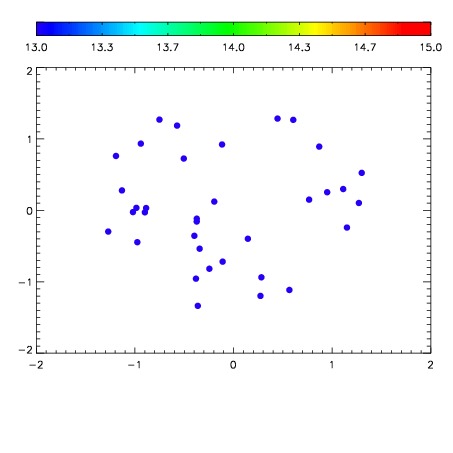

| Frame | Nreads | Zeropoints | Mag plots | Spatial mag deviation | Spatial sky 16325A emission deviations (filled: sky, open: star) | Spatial sky continuum emission | Spatial sky telluric CO2 absorption deviations (filled: H < 10) | |||||||||||||||||||||||
| 0 | 0 |
|
|
|
|
|
|
| IPAIR | NAME | SHIFT | NEWSHIFT | S/N | NAME | SHIFT | NEWSHIFT | S/N |
| 0 | 18160018 | 0.504577 | 0.00000 | 18.2590 | 18160019 | 0.00343721 | 0.501140 | 18.1956 |
| 1 | 18160014 | 0.501392 | 0.00318497 | 18.9037 | 18160016 | 0.000567172 | 0.504010 | 18.7418 |
| 2 | 18160017 | 0.503080 | 0.00149697 | 18.6308 | 18160015 | 0.000715433 | 0.503862 | 18.6390 |
| 3 | 18160013 | 0.500974 | 0.00360298 | 18.6282 | 18160012 | 0.00000 | 0.504577 | 18.6024 |