| Red | Green | Blue | |
| z | 17.64 | ||
| znorm | Inf | ||
| sky | -Inf | -Inf | -Inf |
| S/N | 29.4 | 49.3 | 56.6 |
| S/N(c) | 0.0 | 0.0 | 0.0 |
| SN(E/C) |
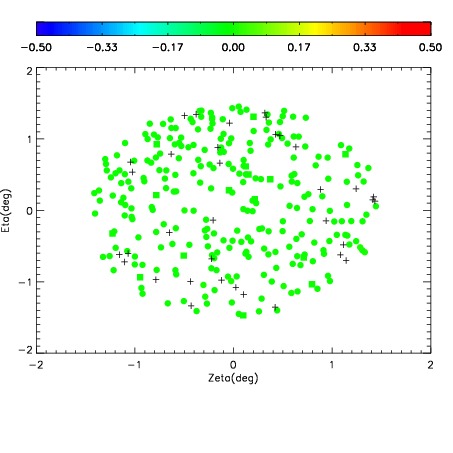
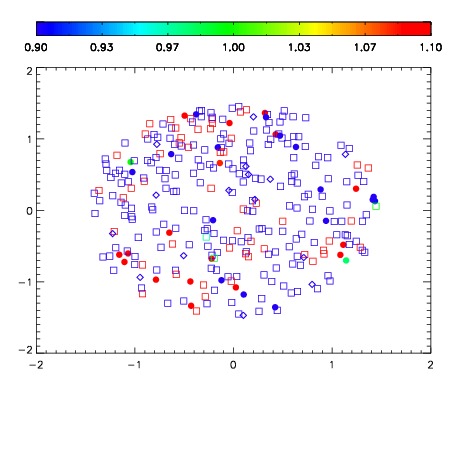
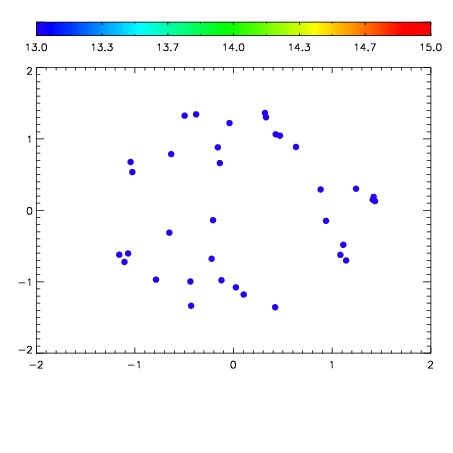

| Frame | Nreads | Zeropoints | Mag plots | Spatial mag deviation | Spatial sky 16325A emission deviations (filled: sky, open: star) | Spatial sky continuum emission | Spatial sky telluric CO2 absorption deviations (filled: H < 10) | |||||||||||||||||||||||
| 0 | 0 |
|
|
|
|
|
|
| IPAIR | NAME | SHIFT | NEWSHIFT | S/N | NAME | SHIFT | NEWSHIFT | S/N |
| 0 | 18130024 | 0.00172323 | 0.00000 | 19.2215 | 18130021 | -0.502864 | 0.504587 | 19.2097 |
| 1 | 18130023 | 0.00150011 | 0.000223120 | 19.2107 | 18130026 | -0.503340 | 0.505063 | 19.1987 |
| 2 | 18130027 | -0.000222844 | 0.00194607 | 19.1947 | 18130025 | -0.503956 | 0.505679 | 19.1974 |
| 3 | 18130020 | 0.00000 | 0.00172323 | 19.1840 | 18130022 | -0.502838 | 0.504561 | 19.1907 |