| Red | Green | Blue | |
| z | 17.64 | ||
| znorm | Inf | ||
| sky | -Inf | -Inf | -NaN |
| S/N | 22.5 | 39.3 | 45.6 |
| S/N(c) | 0.0 | 0.0 | 0.0 |
| SN(E/C) |
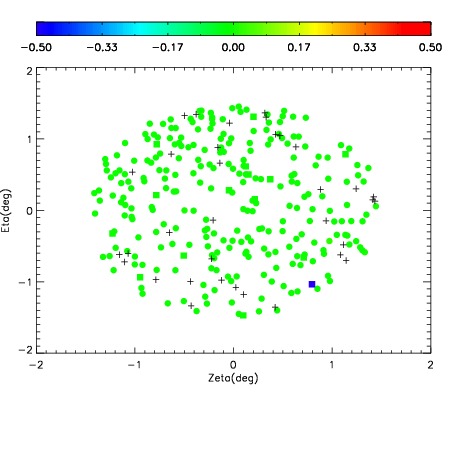
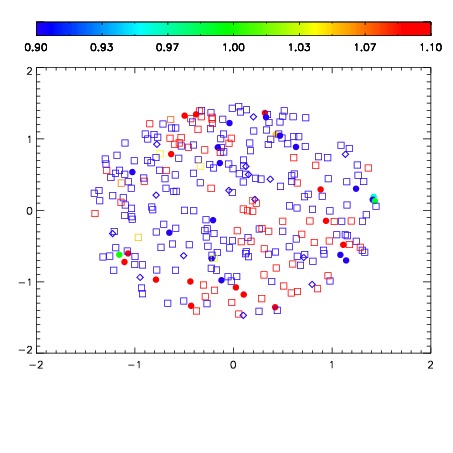
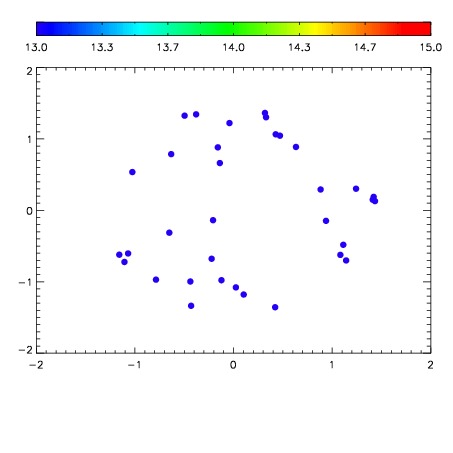

| Frame | Nreads | Zeropoints | Mag plots | Spatial mag deviation | Spatial sky 16325A emission deviations (filled: sky, open: star) | Spatial sky continuum emission | Spatial sky telluric CO2 absorption deviations (filled: H < 10) | |||||||||||||||||||||||
| 0 | 0 |
|
|
|
|
|
|
| IPAIR | NAME | SHIFT | NEWSHIFT | S/N | NAME | SHIFT | NEWSHIFT | S/N |
| 0 | 18420021 | 0.502833 | 0.00000 | 18.3788 | 18420015 | 0.000497428 | 0.502336 | 18.1841 |
| 1 | 18420012 | 0.501641 | 0.00119203 | 18.7068 | 18420011 | 0.00000 | 0.502833 | 18.7797 |
| 2 | 18420013 | 0.501281 | 0.00155199 | 18.6257 | 18420014 | 0.000507203 | 0.502326 | 18.6307 |
| 3 | 18420017 | 0.501008 | 0.00182503 | 18.6243 | 18420018 | 0.000115530 | 0.502717 | 18.5355 |
| 4 | 18420020 | 0.501937 | 0.000896037 | 18.5423 | 18420019 | 0.000851525 | 0.501981 | 18.4677 |
| 5 | 18420016 | 0.500730 | 0.00210303 | 18.5121 | 18420022 | 0.00261554 | 0.500217 | 18.3322 |