| Red | Green | Blue | |
| z | 17.64 | ||
| znorm | Inf | ||
| sky | -Inf | -Inf | -NaN |
| S/N | 21.9 | 39.1 | 44.9 |
| S/N(c) | 0.0 | 0.0 | 0.0 |
| SN(E/C) |

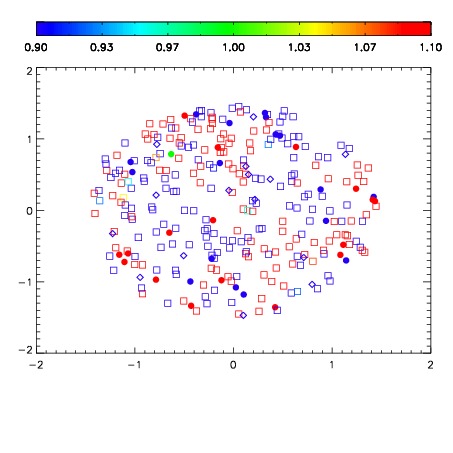
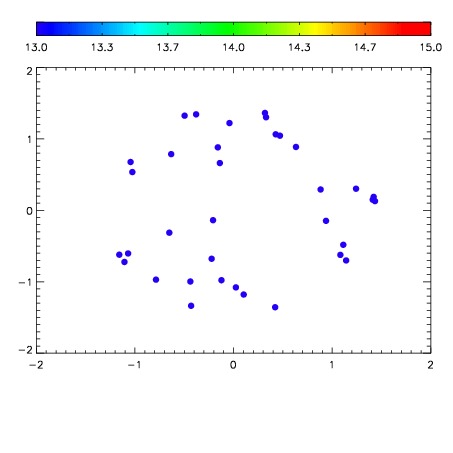

| Frame | Nreads | Zeropoints | Mag plots | Spatial mag deviation | Spatial sky 16325A emission deviations (filled: sky, open: star) | Spatial sky continuum emission | Spatial sky telluric CO2 absorption deviations (filled: H < 10) | |||||||||||||||||||||||
| 0 | 0 |
|
|
|
|
|
|
| IPAIR | NAME | SHIFT | NEWSHIFT | S/N | NAME | SHIFT | NEWSHIFT | S/N |
| 0 | 18450024 | 0.502746 | 0.00000 | 18.3791 | 18450021 | -0.000479188 | 0.503225 | 18.3956 |
| 1 | 18450023 | 0.501825 | 0.000921011 | 18.7203 | 18450025 | 0.00545151 | 0.497294 | 18.6930 |
| 2 | 18450016 | 0.501510 | 0.00123596 | 18.5243 | 18450022 | -0.000441520 | 0.503187 | 18.6535 |
| 3 | 18450015 | 0.500127 | 0.00261897 | 18.5154 | 18450014 | 0.00000 | 0.502746 | 18.5964 |
| 4 | 18450019 | 0.499982 | 0.00276399 | 18.4106 | 18450017 | 0.000941875 | 0.501804 | 18.4151 |
| 5 | 18450020 | 0.500748 | 0.00199801 | 17.7190 | 18450018 | 0.00150032 | 0.501246 | 18.3722 |