| Red | Green | Blue | |
| z | 17.64 | ||
| znorm | Inf | ||
| sky | -NaN | -Inf | -NaN |
| S/N | 24.3 | 43.9 | 49.5 |
| S/N(c) | 0.0 | 0.0 | 0.0 |
| SN(E/C) |
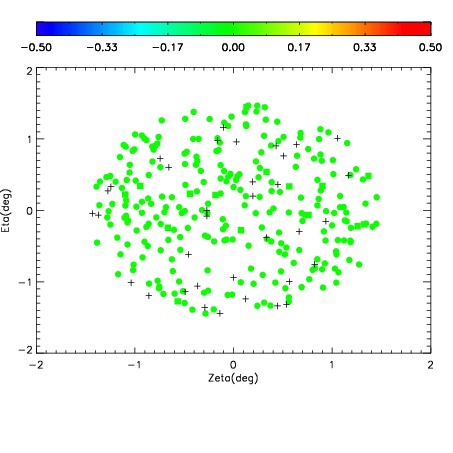
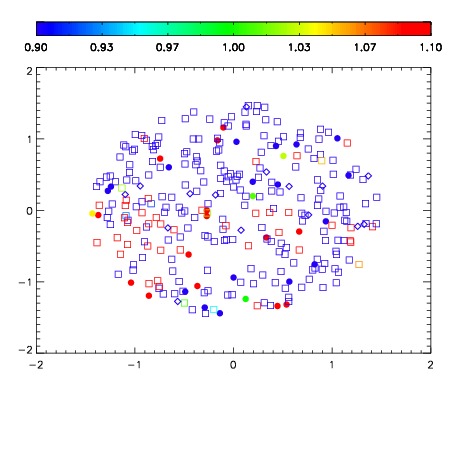
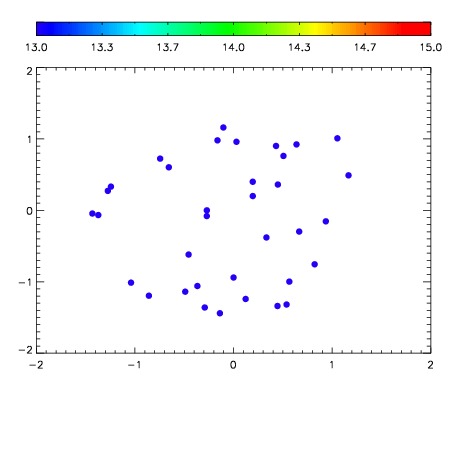

| Frame | Nreads | Zeropoints | Mag plots | Spatial mag deviation | Spatial sky 16325A emission deviations (filled: sky, open: star) | Spatial sky continuum emission | Spatial sky telluric CO2 absorption deviations (filled: H < 10) | |||||||||||||||||||||||
| 0 | 0 |
|
|
|
|
|
|
| IPAIR | NAME | SHIFT | NEWSHIFT | S/N | NAME | SHIFT | NEWSHIFT | S/N |
| 0 | 17660038 | 0.507727 | 0.00000 | 18.9990 | 17660040 | 0.00200447 | 0.505723 | 19.0061 |
| 1 | 17660037 | 0.506392 | 0.00133502 | 19.0706 | 17660036 | 0.00000 | 0.507727 | 19.0583 |
| 2 | 17660042 | 0.507363 | 0.000364006 | 19.0019 | 17660039 | 0.00209459 | 0.505632 | 19.0391 |
| 3 | 17660041 | 0.506492 | 0.00123501 | 18.9111 | 17660043 | 0.00297206 | 0.504755 | 18.9861 |