| Red | Green | Blue | |
| z | 17.64 | ||
| znorm | Inf | ||
| sky | -Inf | -Inf | -NaN |
| S/N | 27.3 | 46.8 | 53.0 |
| S/N(c) | 0.0 | 0.0 | 0.0 |
| SN(E/C) |
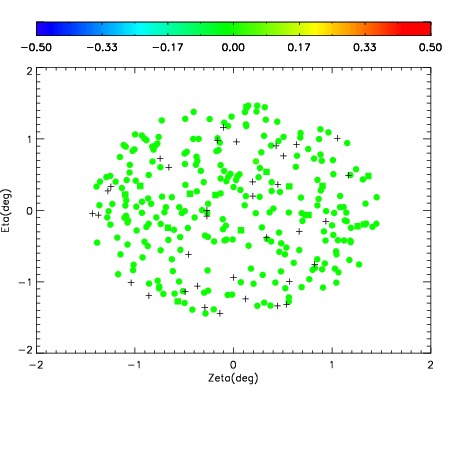
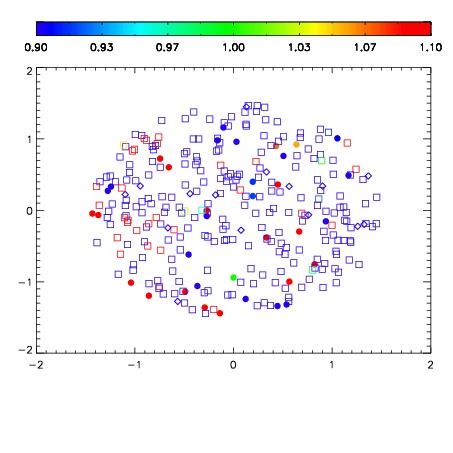
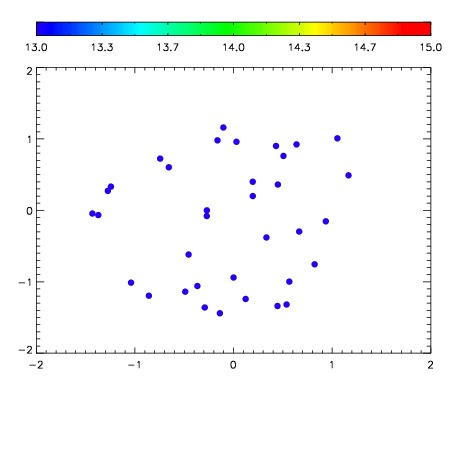

| Frame | Nreads | Zeropoints | Mag plots | Spatial mag deviation | Spatial sky 16325A emission deviations (filled: sky, open: star) | Spatial sky continuum emission | Spatial sky telluric CO2 absorption deviations (filled: H < 10) | |||||||||||||||||||||||
| 0 | 0 |
|
|
|
|
|
|
| IPAIR | NAME | SHIFT | NEWSHIFT | S/N | NAME | SHIFT | NEWSHIFT | S/N |
| 0 | 17690013 | 0.510653 | 0.00000 | 19.0571 | 17690014 | 0.00330352 | 0.507349 | 19.0906 |
| 1 | 17690016 | 0.509627 | 0.00102603 | 19.1159 | 17690015 | 0.00308848 | 0.507565 | 19.0966 |
| 2 | 17690017 | 0.509425 | 0.00122803 | 19.0532 | 17690011 | 0.00000 | 0.510653 | 19.0402 |
| 3 | 17690012 | 0.509844 | 0.000809014 | 19.0233 | 17690018 | -0.000606028 | 0.511259 | 19.0382 |