| Red | Green | Blue | |
| z | 17.64 | ||
| znorm | Inf | ||
| sky | -Inf | -NaN | -NaN |
| S/N | 25.4 | 42.7 | 49.2 |
| S/N(c) | 0.0 | 0.0 | 0.0 |
| SN(E/C) |
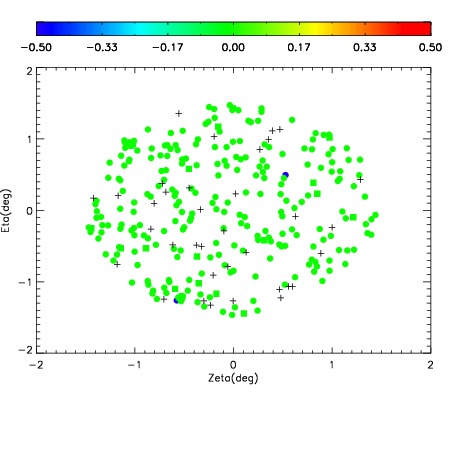
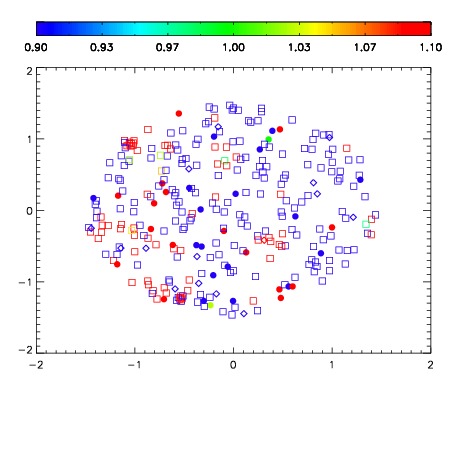
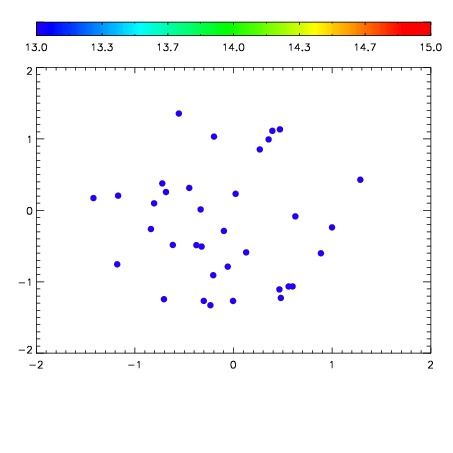

| Frame | Nreads | Zeropoints | Mag plots | Spatial mag deviation | Spatial sky 16325A emission deviations (filled: sky, open: star) | Spatial sky continuum emission | Spatial sky telluric CO2 absorption deviations (filled: H < 10) | |||||||||||||||||||||||
| 0 | 0 |
|
|
|
|
|
|
| IPAIR | NAME | SHIFT | NEWSHIFT | S/N | NAME | SHIFT | NEWSHIFT | S/N |
| 0 | 17610092 | 0.514002 | 0.00000 | 18.9708 | 17610090 | 0.00736611 | 0.506636 | 18.9351 |
| 1 | 17610091 | 0.512808 | 0.00119400 | 18.9647 | 17610089 | 0.00756063 | 0.506441 | 18.8995 |
| 2 | 17610088 | 0.513200 | 0.000802040 | 18.8915 | 17610093 | 0.00877088 | 0.505231 | 18.8978 |
| 3 | 17610087 | 0.512581 | 0.00142103 | 18.8358 | 17610086 | 0.00000 | 0.514002 | 18.6943 |