| Red | Green | Blue | |
| z | 17.64 | ||
| znorm | Inf | ||
| sky | -Inf | -Inf | -Inf |
| S/N | 27.9 | 49.7 | 54.6 |
| S/N(c) | 0.0 | 0.0 | 0.0 |
| SN(E/C) |
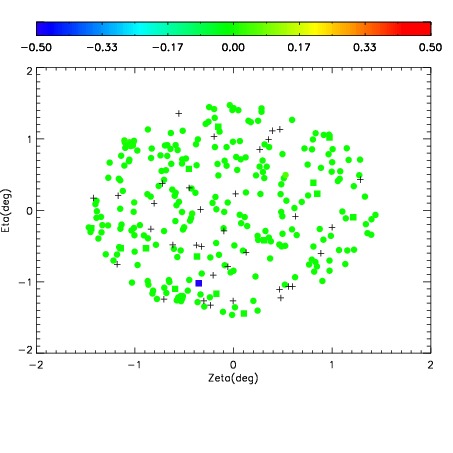
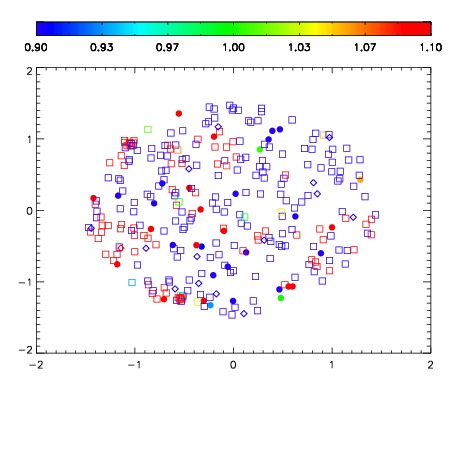
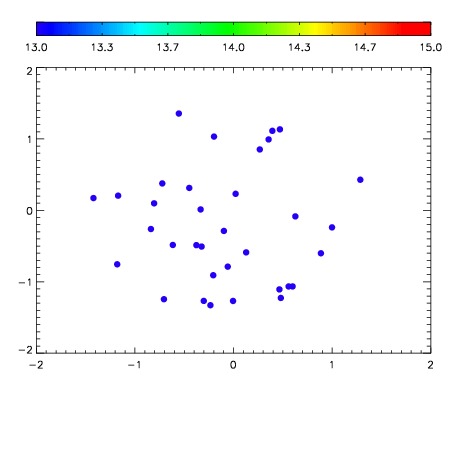

| Frame | Nreads | Zeropoints | Mag plots | Spatial mag deviation | Spatial sky 16325A emission deviations (filled: sky, open: star) | Spatial sky continuum emission | Spatial sky telluric CO2 absorption deviations (filled: H < 10) | |||||||||||||||||||||||
| 0 | 0 |
|
|
|
|
|
|
| IPAIR | NAME | SHIFT | NEWSHIFT | S/N | NAME | SHIFT | NEWSHIFT | S/N |
| 0 | 17660060 | 0.503240 | 0.00000 | 19.0435 | 17660061 | 0.000861184 | 0.502379 | 19.0004 |
| 1 | 17660059 | 0.502752 | 0.000487983 | 19.1315 | 17660065 | 0.00273699 | 0.500503 | 19.0493 |
| 2 | 17660064 | 0.502052 | 0.00118798 | 19.0679 | 17660058 | 0.00000 | 0.503240 | 19.0256 |
| 3 | 17660063 | 0.502087 | 0.00115299 | 19.0186 | 17660062 | 0.000336442 | 0.502904 | 18.9844 |