| Red | Green | Blue | |
| z | 17.64 | ||
| znorm | Inf | ||
| sky | -Inf | -Inf | -NaN |
| S/N | 19.3 | 35.0 | 37.3 |
| S/N(c) | 0.0 | 0.0 | 0.0 |
| SN(E/C) |
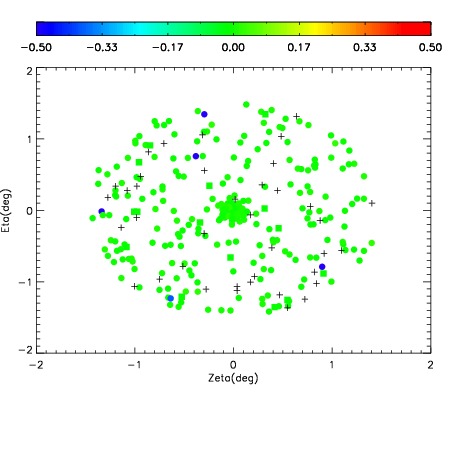
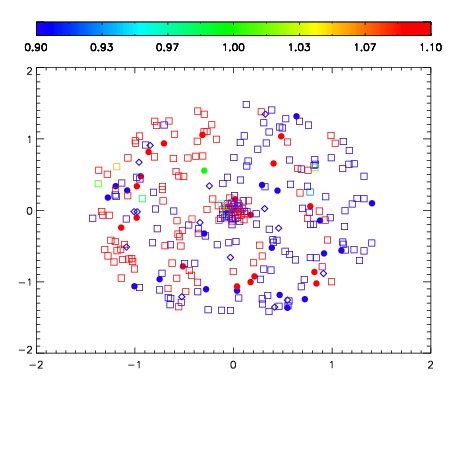
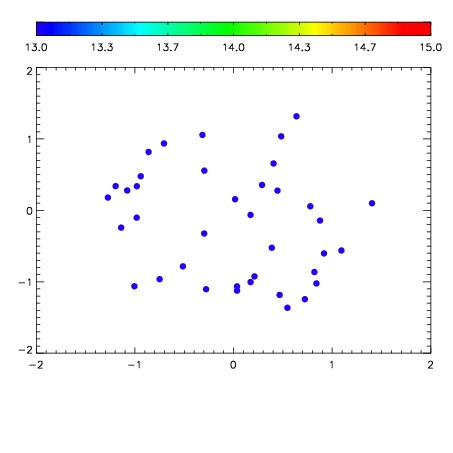

| Frame | Nreads | Zeropoints | Mag plots | Spatial mag deviation | Spatial sky 16325A emission deviations (filled: sky, open: star) | Spatial sky continuum emission | Spatial sky telluric CO2 absorption deviations (filled: H < 10) | |||||||||||||||||||||||
| 0 | 0 |
|
|
|
|
|
|
| IPAIR | NAME | SHIFT | NEWSHIFT | S/N | NAME | SHIFT | NEWSHIFT | S/N |
| 0 | 19990023 | 0.00000 | 0.00000 | 19.0015 | 19990025 | -0.503024 | 0.503024 | 19.0439 |
| 1 | 19990027 | -0.00116995 | 0.00116995 | 19.1146 | 19990028 | -0.505466 | 0.505466 | 19.0823 |
| 2 | 19990026 | -0.000425122 | 0.000425122 | 19.0944 | 19990024 | -0.503489 | 0.503489 | 19.0487 |