| Red | Green | Blue | |
| z | 17.64 | ||
| znorm | Inf | ||
| sky | -Inf | -NaN | -NaN |
| S/N | 8.0 | 15.8 | 17.8 |
| S/N(c) | 0.0 | 0.0 | 0.0 |
| SN(E/C) |
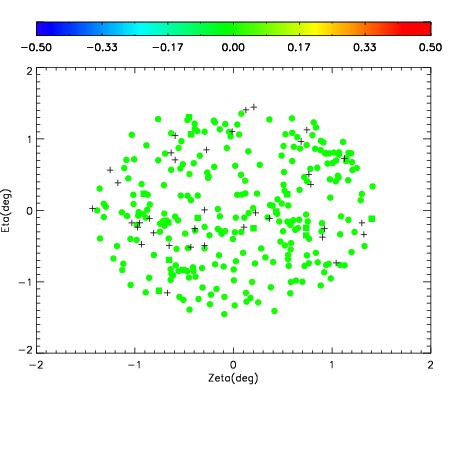
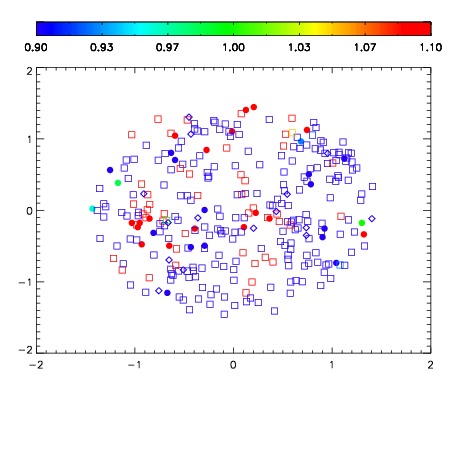
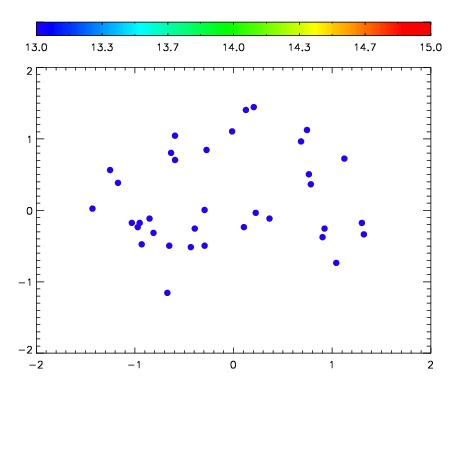

| Frame | Nreads | Zeropoints | Mag plots | Spatial mag deviation | Spatial sky 16325A emission deviations (filled: sky, open: star) | Spatial sky continuum emission | Spatial sky telluric CO2 absorption deviations (filled: H < 10) | |||||||||||||||||||||||
| 0 | 0 |
|
|
|
|
|
|
| IPAIR | NAME | SHIFT | NEWSHIFT | S/N | NAME | SHIFT | NEWSHIFT | S/N |
| 0 | 17590082 | 0.504420 | 0.00000 | 17.5483 | 17590081 | 0.00282239 | 0.501598 | 17.3507 |
| 1 | 17590078 | 0.501865 | 0.00255495 | 17.9350 | 17590077 | 0.00000 | 0.504420 | 18.4398 |
| 2 | 17590079 | 0.504380 | 3.99947e-05 | 17.1182 | 17590080 | 0.00374193 | 0.500678 | 16.4947 |