| Red | Green | Blue | |
| z | 17.64 | ||
| znorm | Inf | ||
| sky | -Inf | -Inf | -NaN |
| S/N | 21.4 | 38.0 | 43.1 |
| S/N(c) | 0.0 | 0.0 | 0.0 |
| SN(E/C) |
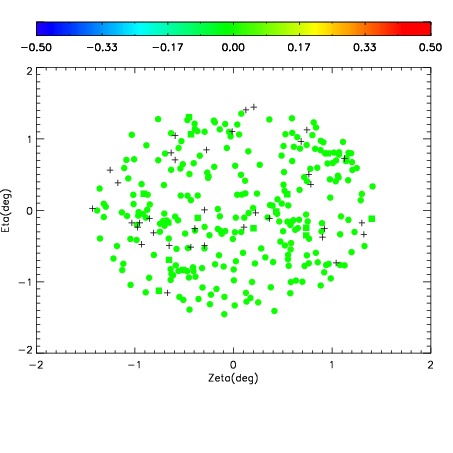
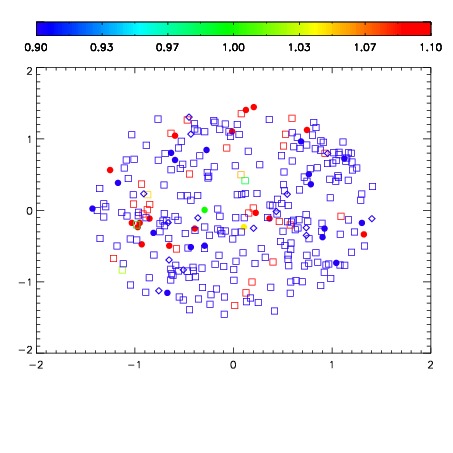
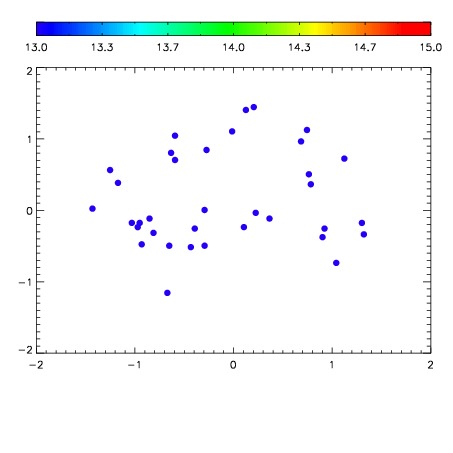

| Frame | Nreads | Zeropoints | Mag plots | Spatial mag deviation | Spatial sky 16325A emission deviations (filled: sky, open: star) | Spatial sky continuum emission | Spatial sky telluric CO2 absorption deviations (filled: H < 10) | |||||||||||||||||||||||
| 0 | 0 |
|
|
|
|
|
|
| IPAIR | NAME | SHIFT | NEWSHIFT | S/N | NAME | SHIFT | NEWSHIFT | S/N |
| 0 | 17600070 | 0.00243491 | 0.00000 | 18.6945 | 17600068 | -0.504153 | 0.506588 | 18.7326 |
| 1 | 17600074 | 0.00168698 | 0.000747930 | 18.8435 | 17600073 | -0.505084 | 0.507519 | 18.8791 |
| 2 | 17600067 | 0.00000 | 0.00243491 | 18.7784 | 17600072 | -0.504600 | 0.507035 | 18.8427 |
| 3 | 17600071 | 0.00226714 | 0.000167770 | 18.7111 | 17600069 | -0.504280 | 0.506715 | 18.7488 |