| Red | Green | Blue | |
| z | 17.64 | ||
| znorm | Inf | ||
| sky | -Inf | -NaN | -Inf |
| S/N | 28.0 | 47.7 | 53.5 |
| S/N(c) | 0.0 | 0.0 | 0.0 |
| SN(E/C) |
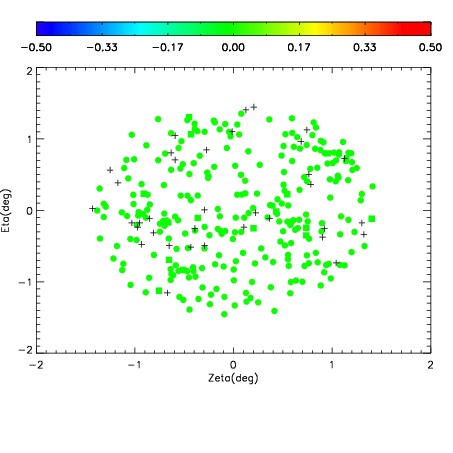
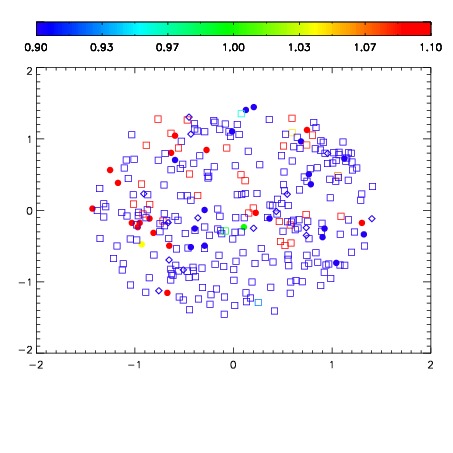
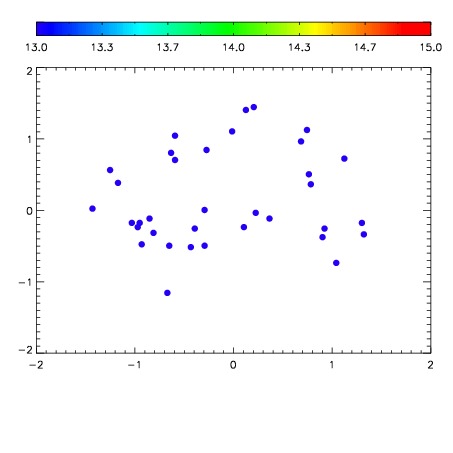

| Frame | Nreads | Zeropoints | Mag plots | Spatial mag deviation | Spatial sky 16325A emission deviations (filled: sky, open: star) | Spatial sky continuum emission | Spatial sky telluric CO2 absorption deviations (filled: H < 10) | |||||||||||||||||||||||
| 0 | 0 |
|
|
|
|
|
|
| IPAIR | NAME | SHIFT | NEWSHIFT | S/N | NAME | SHIFT | NEWSHIFT | S/N |
| 0 | 17650054 | 0.509159 | 0.00000 | 19.1347 | 17650052 | 0.00121741 | 0.507942 | 19.1542 |
| 1 | 17650049 | 0.508086 | 0.00107300 | 19.1335 | 17650051 | 0.00150872 | 0.507650 | 19.1291 |
| 2 | 17650050 | 0.507954 | 0.00120503 | 19.0995 | 17650048 | 0.00000 | 0.509159 | 19.1175 |
| 3 | 17650053 | 0.508952 | 0.000207007 | 19.0968 | 17650055 | 0.00333772 | 0.505821 | 19.0286 |