| Red | Green | Blue | |
| z | 17.64 | ||
| znorm | Inf | ||
| sky | -Inf | -NaN | -NaN |
| S/N | 22.1 | 40.8 | 45.4 |
| S/N(c) | 0.0 | 0.0 | 0.0 |
| SN(E/C) |
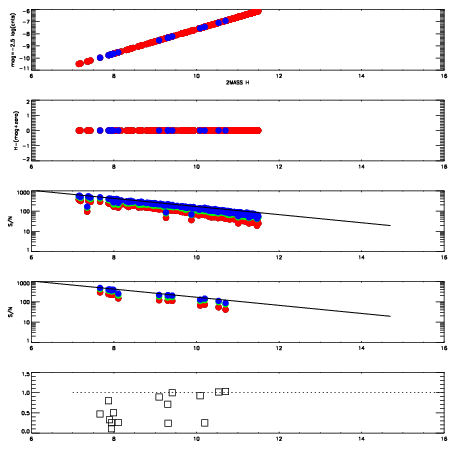
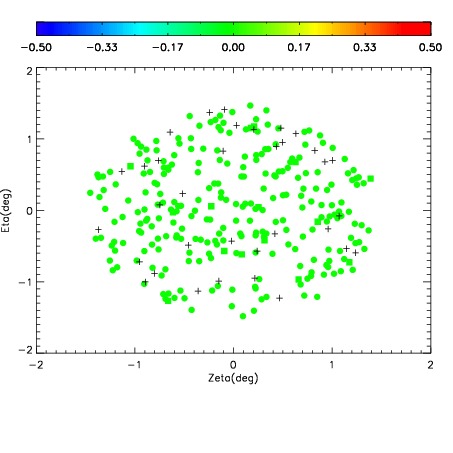
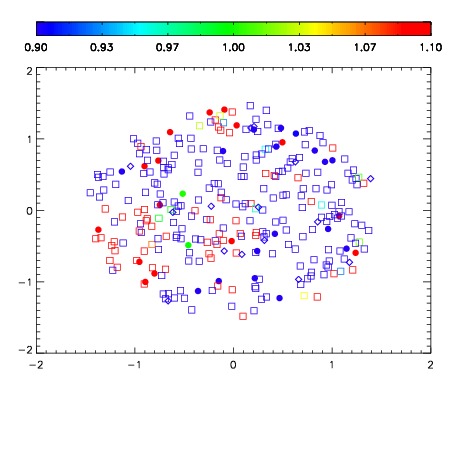


| Frame | Nreads | Zeropoints | Mag plots | Spatial mag deviation | Spatial sky 16325A emission deviations (filled: sky, open: star) | Spatial sky continuum emission | Spatial sky telluric CO2 absorption deviations (filled: H < 10) | |||||||||||||||||||||||
| 0 | 0 |
|
|
|
|
|
|
| IPAIR | NAME | SHIFT | NEWSHIFT | S/N | NAME | SHIFT | NEWSHIFT | S/N |
| 0 | 18700028 | 0.511325 | 0.00000 | 17.6430 | 18700025 | -0.000446391 | 0.511771 | 17.6076 |
| 1 | 18700039 | 0.507325 | 0.00400001 | 18.3026 | 18700038 | 0.00124043 | 0.510085 | 18.2406 |
| 2 | 18700036 | 0.507828 | 0.00349700 | 18.0723 | 18700026 | -0.000749987 | 0.512075 | 18.1605 |
| 3 | 18700032 | 0.507024 | 0.00430101 | 17.9901 | 18700037 | 0.00177802 | 0.509547 | 18.0391 |
| 4 | 18700035 | 0.507193 | 0.00413197 | 17.9785 | 18700034 | 0.000994004 | 0.510331 | 17.9069 |
| 5 | 18700027 | 0.510098 | 0.00122702 | 17.9134 | 18700022 | 0.00000 | 0.511325 | 17.8074 |
| 6 | 18700031 | 0.506429 | 0.00489599 | 17.7405 | 18700029 | 0.000931155 | 0.510394 | 17.7087 |
| 7 | 18700024 | 0.510046 | 0.00127900 | 17.7332 | 18700030 | 0.000923017 | 0.510402 | 17.6549 |
| 8 | 18700023 | 0.509418 | 0.00190699 | 17.7279 | 18700033 | 0.00156071 | 0.509764 | 17.6508 |