| Red | Green | Blue | |
| z | 17.64 | ||
| znorm | Inf | ||
| sky | -Inf | -Inf | -Inf |
| S/N | 26.8 | 49.9 | 52.5 |
| S/N(c) | 0.0 | 0.0 | 0.0 |
| SN(E/C) |
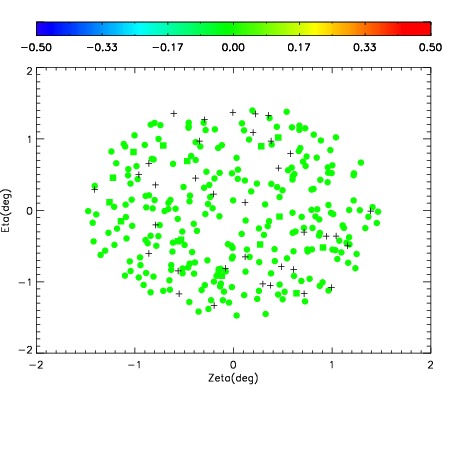

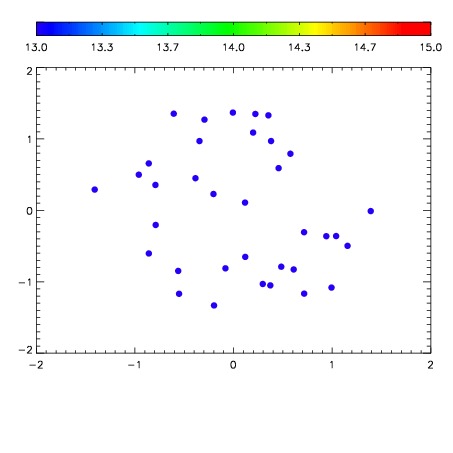

| Frame | Nreads | Zeropoints | Mag plots | Spatial mag deviation | Spatial sky 16325A emission deviations (filled: sky, open: star) | Spatial sky continuum emission | Spatial sky telluric CO2 absorption deviations (filled: H < 10) | |||||||||||||||||||||||
| 0 | 0 |
|
|
|
|
|
|
| IPAIR | NAME | SHIFT | NEWSHIFT | S/N | NAME | SHIFT | NEWSHIFT | S/N |
| 0 | 18670024 | 0.505825 | 0.00000 | 17.4245 | 18670022 | 0.00000 | 0.505825 | 17.4767 |
| 1 | 18670027 | 0.502253 | 0.00357199 | 18.8677 | 18670026 | 0.000609485 | 0.505216 | 18.8327 |
| 2 | 18670032 | 0.503121 | 0.00270396 | 18.8096 | 18670033 | 0.00172373 | 0.504101 | 18.8144 |
| 3 | 18670039 | 0.503906 | 0.00191897 | 18.6722 | 18670038 | 0.000889981 | 0.504935 | 18.7573 |
| 4 | 18670035 | 0.503465 | 0.00235999 | 18.1569 | 18670037 | 0.00199798 | 0.503827 | 18.1729 |
| 5 | 18670036 | 0.505311 | 0.000513971 | 18.0322 | 18670034 | 0.00212238 | 0.503703 | 18.1284 |
| 6 | 18670031 | 0.505035 | 0.000790000 | 17.9705 | 18670029 | 0.000830779 | 0.504994 | 17.9684 |
| 7 | 18670028 | 0.504248 | 0.00157696 | 17.9217 | 18670030 | 0.00213733 | 0.503688 | 17.8332 |
| 8 | 18670023 | 0.504519 | 0.00130600 | 17.5959 | 18670025 | 0.00228405 | 0.503541 | 17.5475 |