| Red | Green | Blue | |
| z | 17.64 | ||
| znorm | Inf | ||
| sky | -Inf | -Inf | -Inf |
| S/N | 27.3 | 48.3 | 56.5 |
| S/N(c) | 0.0 | 0.0 | 0.0 |
| SN(E/C) |
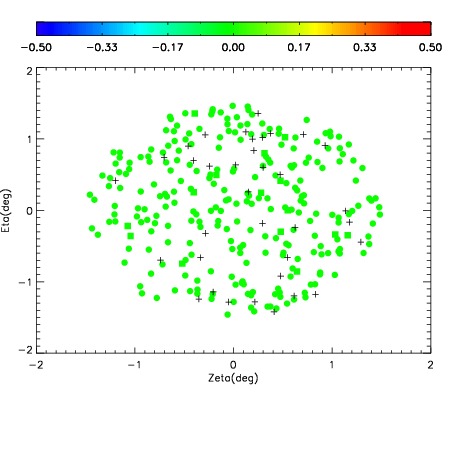
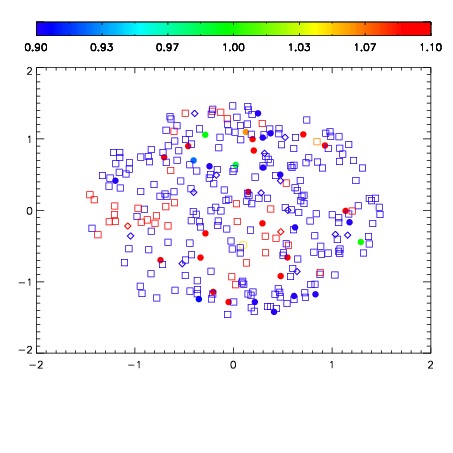
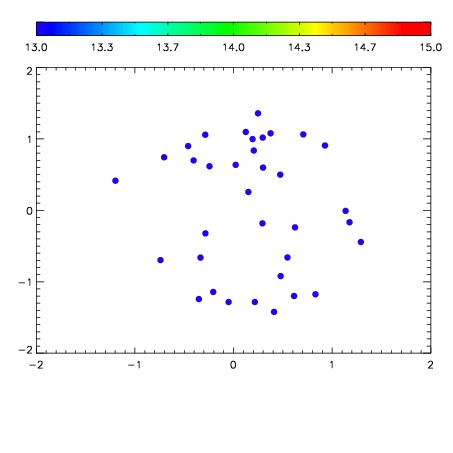

| Frame | Nreads | Zeropoints | Mag plots | Spatial mag deviation | Spatial sky 16325A emission deviations (filled: sky, open: star) | Spatial sky continuum emission | Spatial sky telluric CO2 absorption deviations (filled: H < 10) | |||||||||||||||||||||||
| 0 | 0 |
|
|
|
|
|
|
| IPAIR | NAME | SHIFT | NEWSHIFT | S/N | NAME | SHIFT | NEWSHIFT | S/N |
| 0 | 18680023 | 0.508820 | 0.00000 | 17.5297 | 18680022 | 0.00000 | 0.508820 | 17.4026 |
| 1 | 18680032 | 0.504952 | 0.00386798 | 18.6761 | 18680033 | -0.00108710 | 0.509907 | 18.7059 |
| 2 | 18680027 | 0.505692 | 0.00312799 | 18.6343 | 18680038 | -0.00135746 | 0.510177 | 18.6395 |
| 3 | 18680039 | 0.504876 | 0.00394398 | 18.5760 | 18680026 | -0.00139469 | 0.510215 | 18.5530 |
| 4 | 18680036 | 0.505025 | 0.00379497 | 18.2109 | 18680037 | 5.68889e-05 | 0.508763 | 18.2486 |
| 5 | 18680031 | 0.505938 | 0.00288200 | 18.0646 | 18680030 | 0.000269206 | 0.508551 | 18.0772 |
| 6 | 18680035 | 0.504991 | 0.00382900 | 18.0172 | 18680034 | -0.000749248 | 0.509569 | 18.0145 |
| 7 | 18680024 | 0.508630 | 0.000190020 | 17.8189 | 18680029 | 0.000536252 | 0.508284 | 17.8071 |
| 8 | 18680028 | 0.506912 | 0.00190800 | 17.7705 | 18680025 | -0.000196187 | 0.509016 | 17.7899 |