| Red | Green | Blue | |
| z | 17.64 | ||
| znorm | Inf | ||
| sky | -Inf | -Inf | -Inf |
| S/N | 29.5 | 53.2 | 57.8 |
| S/N(c) | 0.0 | 0.0 | 0.0 |
| SN(E/C) |
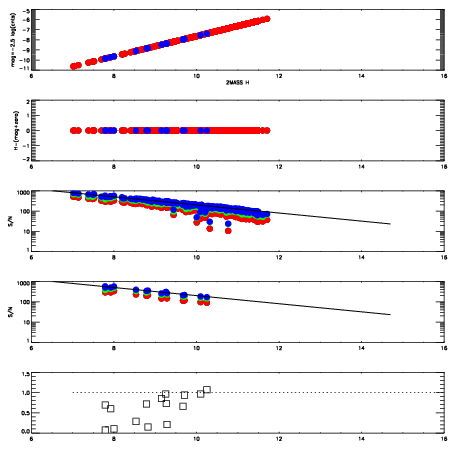
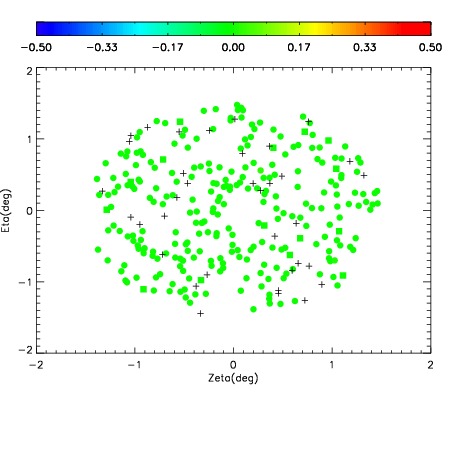
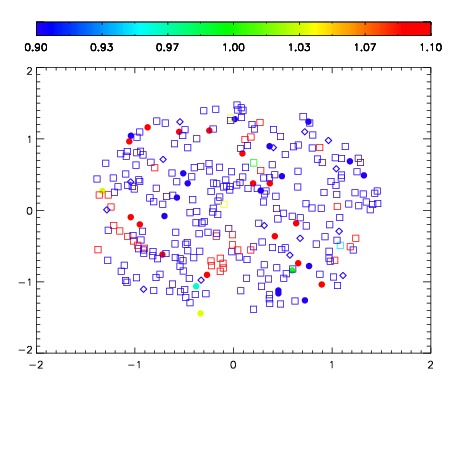
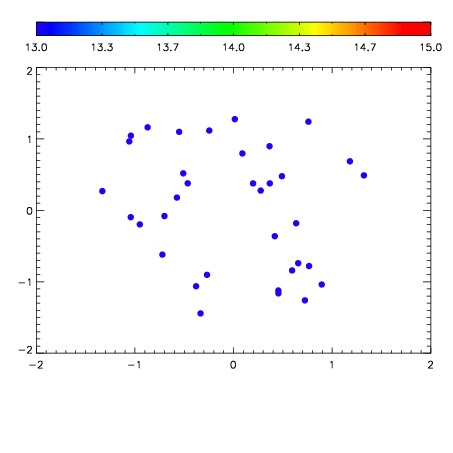

| Frame | Nreads | Zeropoints | Mag plots | Spatial mag deviation | Spatial sky 16325A emission deviations (filled: sky, open: star) | Spatial sky continuum emission | Spatial sky telluric CO2 absorption deviations (filled: H < 10) | |||||||||||||||||||||||
| 0 | 0 |
|
|
|
|
|
|
| IPAIR | NAME | SHIFT | NEWSHIFT | S/N | NAME | SHIFT | NEWSHIFT | S/N |
| 0 | 17770044 | 0.00332294 | 0.00000 | 18.0763 | 17770042 | -0.508529 | 0.511852 | 18.1081 |
| 1 | 17770024 | 0.00104331 | 0.00227963 | 18.8809 | 17770025 | -0.510730 | 0.514053 | 18.5969 |
| 2 | 17770036 | 0.00198625 | 0.00133669 | 18.5790 | 17770030 | -0.512119 | 0.515442 | 18.5333 |
| 3 | 17770031 | 0.00153439 | 0.00178855 | 18.5036 | 17770037 | -0.509127 | 0.512450 | 18.4813 |
| 4 | 17770040 | 0.00249769 | 0.000825250 | 18.4694 | 17770041 | -0.508514 | 0.511837 | 18.4305 |
| 5 | 17770043 | 0.00259768 | 0.000725260 | 18.2938 | 17770033 | -0.510829 | 0.514152 | 18.3315 |
| 6 | 17770032 | 0.00104855 | 0.00227439 | 18.2395 | 17770045 | -0.508194 | 0.511517 | 18.3236 |
| 7 | 17770035 | 0.00115872 | 0.00216422 | 17.9944 | 17770038 | -0.509857 | 0.513180 | 17.9318 |
| 8 | 17770023 | 0.000962186 | 0.00236075 | 17.9808 | 17770022 | -0.512204 | 0.515527 | 17.8786 |
| 9 | 17770028 | 0.00130707 | 0.00201587 | 17.7466 | 17770034 | -0.510071 | 0.513394 | 17.8480 |
| 10 | 17770027 | 0.000588030 | 0.00273491 | 17.7094 | 17770026 | -0.510446 | 0.513769 | 17.8431 |
| 11 | 17770020 | 0.00000 | 0.00332294 | 17.5788 | 17770029 | -0.511972 | 0.515295 | 17.8151 |
| 12 | 17770039 | 0.00186680 | 0.00145614 | 16.2752 | 17770021 | -0.512741 | 0.516064 | 17.7816 |