| Red | Green | Blue | |
| z | 17.64 | ||
| znorm | Inf | ||
| sky | -Inf | -NaN | -NaN |
| S/N | 25.8 | 48.7 | 51.8 |
| S/N(c) | 0.0 | 0.0 | 0.0 |
| SN(E/C) |
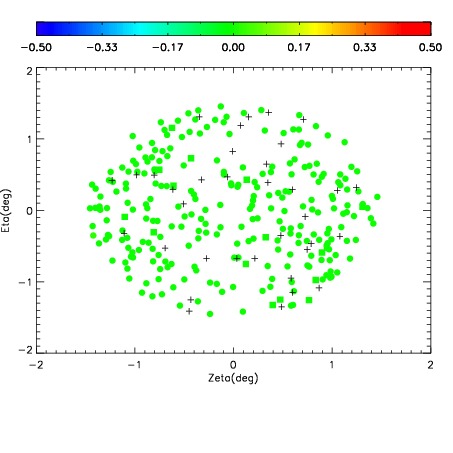
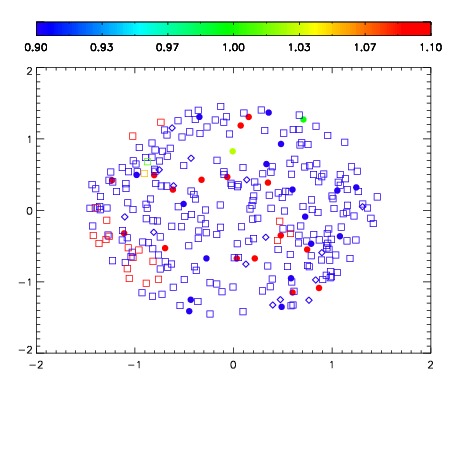


| Frame | Nreads | Zeropoints | Mag plots | Spatial mag deviation | Spatial sky 16325A emission deviations (filled: sky, open: star) | Spatial sky continuum emission | Spatial sky telluric CO2 absorption deviations (filled: H < 10) | |||||||||||||||||||||||
| 0 | 0 |
|
|
|
|
|
|
| IPAIR | NAME | SHIFT | NEWSHIFT | S/N | NAME | SHIFT | NEWSHIFT | S/N |
| 0 | 18660027 | 0.499909 | 0.00000 | 17.9792 | 18660029 | 0.00460363 | 0.495305 | 18.0161 |
| 1 | 18660026 | 0.497559 | 0.00235000 | 18.9090 | 18660032 | 0.00287560 | 0.497033 | 18.8803 |
| 2 | 18660031 | 0.496493 | 0.00341600 | 18.8923 | 18660025 | 0.00303613 | 0.496873 | 18.8752 |
| 3 | 18660038 | 0.497164 | 0.00274500 | 18.8250 | 18660037 | -7.29985e-05 | 0.499982 | 18.8244 |
| 4 | 18660035 | 0.499274 | 0.000635028 | 18.2968 | 18660036 | 0.00128463 | 0.498624 | 18.3325 |
| 5 | 18660034 | 0.497413 | 0.00249600 | 18.1912 | 18660033 | 0.00351392 | 0.496395 | 18.1259 |
| 6 | 18660030 | 0.498822 | 0.00108701 | 17.9987 | 18660028 | 0.00409521 | 0.495814 | 18.0502 |
| 7 | 18660023 | 0.499794 | 0.000115007 | 17.7400 | 18660024 | 0.00479294 | 0.495116 | 17.8322 |
| 8 | 18660022 | 0.498194 | 0.00171500 | 17.7137 | 18660021 | 0.00000 | 0.499909 | 17.5001 |