| Red | Green | Blue | |
| z | 17.64 | ||
| znorm | Inf | ||
| sky | -Inf | -Inf | -Inf |
| S/N | 15.2 | 28.1 | 29.0 |
| S/N(c) | 0.0 | 0.0 | 0.0 |
| SN(E/C) |

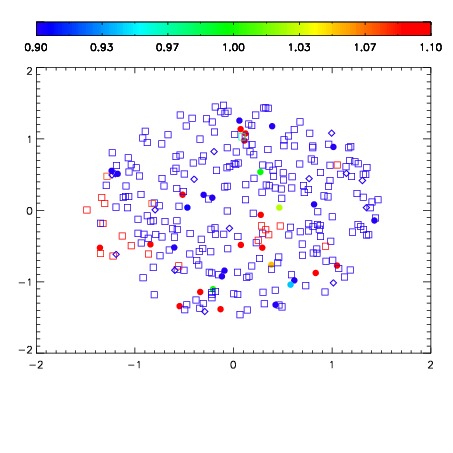
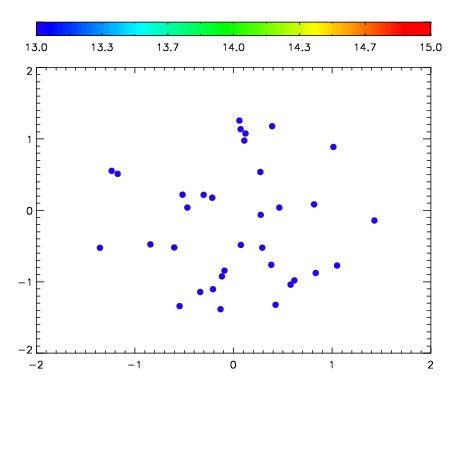

| Frame | Nreads | Zeropoints | Mag plots | Spatial mag deviation | Spatial sky 16325A emission deviations (filled: sky, open: star) | Spatial sky continuum emission | Spatial sky telluric CO2 absorption deviations (filled: H < 10) | |||||||||||||||||||||||
| 0 | 0 |
|
|
|
|
|
|
| IPAIR | NAME | SHIFT | NEWSHIFT | S/N | NAME | SHIFT | NEWSHIFT | S/N |
| 0 | 18100013 | 0.505991 | 0.00000 | 18.0849 | 18100014 | 0.00595830 | 0.500033 | 18.1788 |
| 1 | 18100012 | 0.503539 | 0.00245196 | 18.2665 | 18100011 | 0.00000 | 0.505991 | 18.2040 |
| 2 | 18100016 | 0.505203 | 0.000787973 | 18.0534 | 18100015 | 0.00599057 | 0.500000 | 18.1166 |