| Red | Green | Blue | |
| z | 17.64 | ||
| znorm | Inf | ||
| sky | -Inf | -Inf | -Inf |
| S/N | 28.2 | 53.1 | 56.8 |
| S/N(c) | 0.0 | 0.0 | 0.0 |
| SN(E/C) |
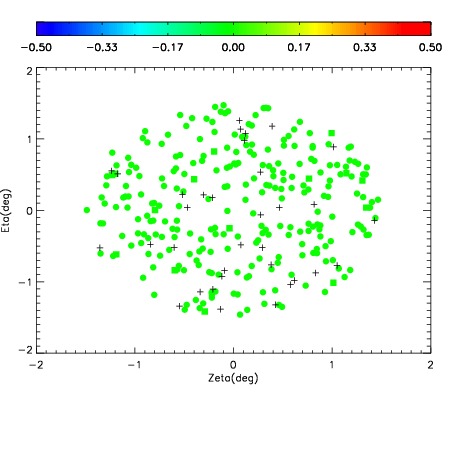
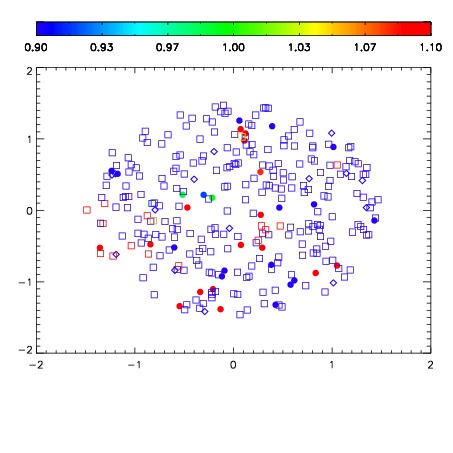
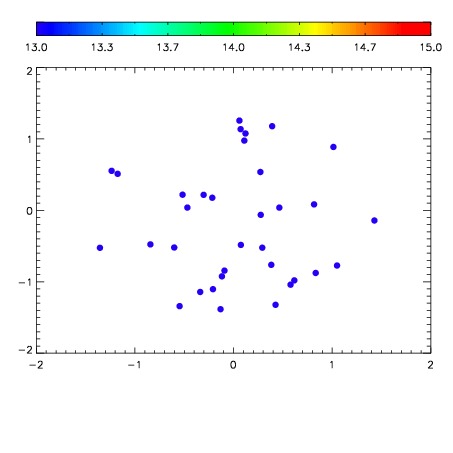

| Frame | Nreads | Zeropoints | Mag plots | Spatial mag deviation | Spatial sky 16325A emission deviations (filled: sky, open: star) | Spatial sky continuum emission | Spatial sky telluric CO2 absorption deviations (filled: H < 10) | |||||||||||||||||||||||
| 0 | 0 |
|
|
|
|
|
|
| IPAIR | NAME | SHIFT | NEWSHIFT | S/N | NAME | SHIFT | NEWSHIFT | S/N |
| 0 | 18110018 | 0.506039 | 0.00000 | 17.9090 | 18110016 | 0.00000 | 0.506039 | 17.9211 |
| 1 | 18110029 | 0.504175 | 0.00186402 | 18.5359 | 18110028 | -0.00268777 | 0.508727 | 18.5275 |
| 2 | 18110030 | 0.505039 | 0.00100005 | 18.3986 | 18110020 | -8.56083e-05 | 0.506125 | 18.4657 |
| 3 | 18110021 | 0.504693 | 0.00134605 | 18.3829 | 18110031 | -0.000625152 | 0.506664 | 18.3960 |
| 4 | 18110022 | 0.504654 | 0.00138503 | 18.3151 | 18110023 | 0.000275891 | 0.505763 | 18.3517 |
| 5 | 18110026 | 0.504086 | 0.00195301 | 18.3107 | 18110032 | -0.00114541 | 0.507184 | 18.2899 |
| 6 | 18110033 | 0.505585 | 0.000454009 | 18.2303 | 18110027 | -0.00142968 | 0.507469 | 18.1786 |
| 7 | 18110025 | 0.504210 | 0.00182903 | 18.1859 | 18110024 | -0.000426553 | 0.506466 | 18.1443 |
| 8 | 18110017 | 0.504856 | 0.00118303 | 18.0530 | 18110019 | 0.000761459 | 0.505278 | 17.9692 |