| Red | Green | Blue | |
| z | 17.64 | ||
| znorm | Inf | ||
| sky | -NaN | -Inf | -NaN |
| S/N | 23.5 | 41.8 | 43.6 |
| S/N(c) | 0.0 | 0.0 | 0.0 |
| SN(E/C) |
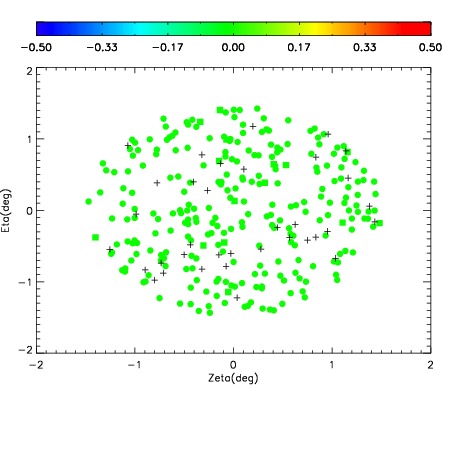
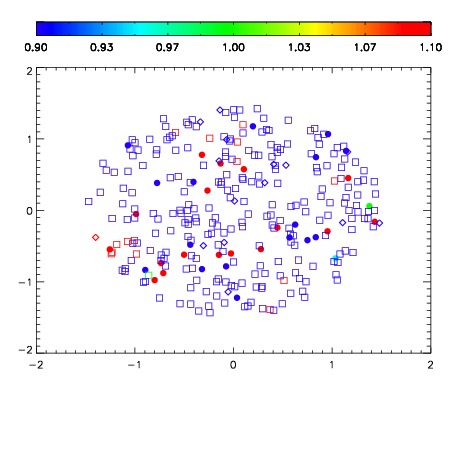
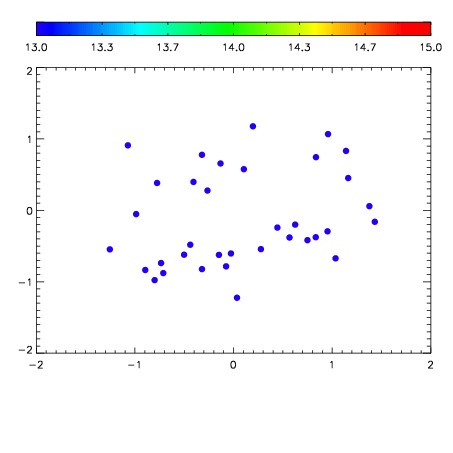

| Frame | Nreads | Zeropoints | Mag plots | Spatial mag deviation | Spatial sky 16325A emission deviations (filled: sky, open: star) | Spatial sky continuum emission | Spatial sky telluric CO2 absorption deviations (filled: H < 10) | |||||||||||||||||||||||
| 0 | 0 |
|
|
|
|
|
|
| IPAIR | NAME | SHIFT | NEWSHIFT | S/N | NAME | SHIFT | NEWSHIFT | S/N |
| 0 | 18610039 | 0.505551 | 0.00000 | 17.9106 | 18610040 | 0.00189831 | 0.503653 | 18.1764 |
| 1 | 18610043 | 0.502768 | 0.00278300 | 18.4603 | 18610044 | -0.000416191 | 0.505967 | 18.5447 |
| 2 | 18610042 | 0.504483 | 0.00106800 | 18.3739 | 18610041 | 0.00117007 | 0.504381 | 18.3502 |
| 3 | 18610046 | 0.503462 | 0.00208896 | 18.3519 | 18610045 | 0.00141840 | 0.504133 | 18.3443 |
| 4 | 18610047 | 0.503478 | 0.00207299 | 18.3423 | 18610048 | -1.25036e-05 | 0.505563 | 18.2876 |
| 5 | 18610038 | 0.503338 | 0.00221300 | 18.0824 | 18610037 | 0.00000 | 0.505551 | 18.2381 |