| Red | Green | Blue | |
| z | 17.64 | ||
| znorm | Inf | ||
| sky | -Inf | -Inf | -Inf |
| S/N | 15.9 | 28.6 | 29.2 |
| S/N(c) | 0.0 | 0.0 | 0.0 |
| SN(E/C) |
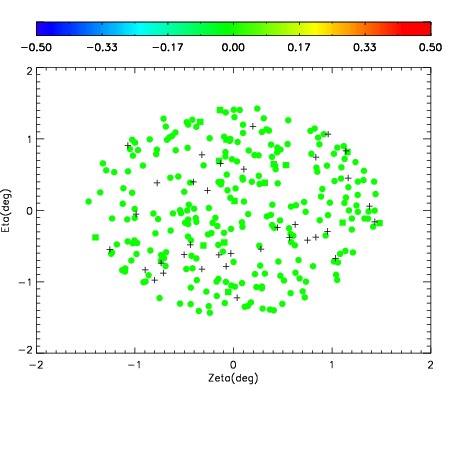
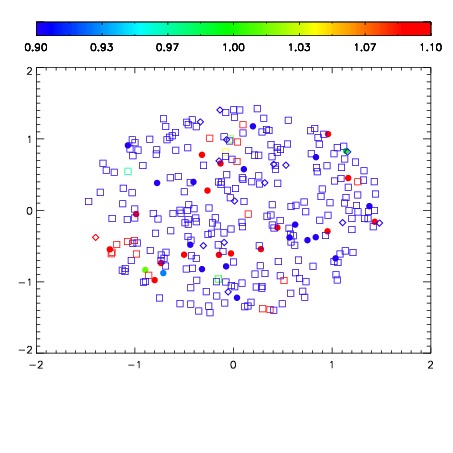
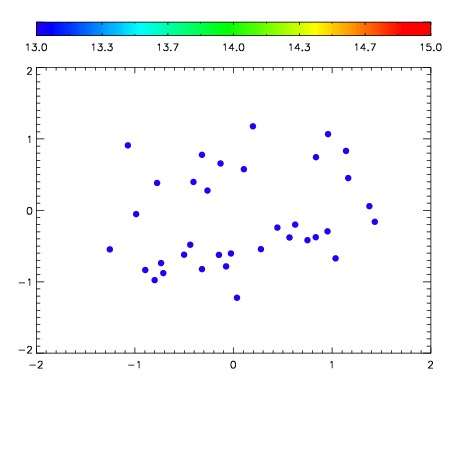

| Frame | Nreads | Zeropoints | Mag plots | Spatial mag deviation | Spatial sky 16325A emission deviations (filled: sky, open: star) | Spatial sky continuum emission | Spatial sky telluric CO2 absorption deviations (filled: H < 10) | |||||||||||||||||||||||
| 0 | 0 |
|
|
|
|
|
|
| IPAIR | NAME | SHIFT | NEWSHIFT | S/N | NAME | SHIFT | NEWSHIFT | S/N |
| 0 | 18620043 | 0.00557600 | 0.00000 | 18.2365 | 18620044 | -0.495022 | 0.500598 | 18.2441 |
| 1 | 18620039 | 0.00000 | 0.00557600 | 18.3750 | 18620040 | -0.496119 | 0.501695 | 18.3956 |
| 2 | 18620042 | 0.00404290 | 0.00153310 | 18.1398 | 18620041 | -0.495889 | 0.501465 | 18.1713 |