| Red | Green | Blue | |
| z | 17.64 | ||
| znorm | Inf | ||
| sky | -Inf | -NaN | -Inf |
| S/N | 12.0 | 25.5 | 29.5 |
| S/N(c) | 0.0 | 0.0 | 0.0 |
| SN(E/C) |
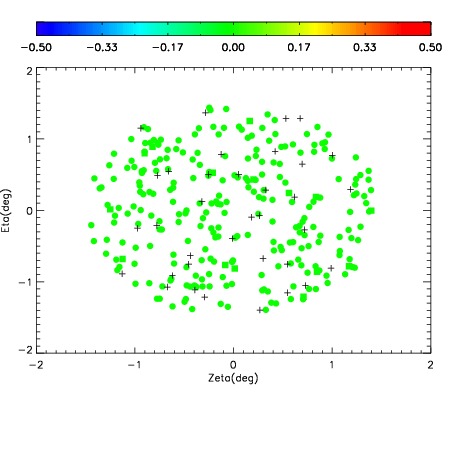
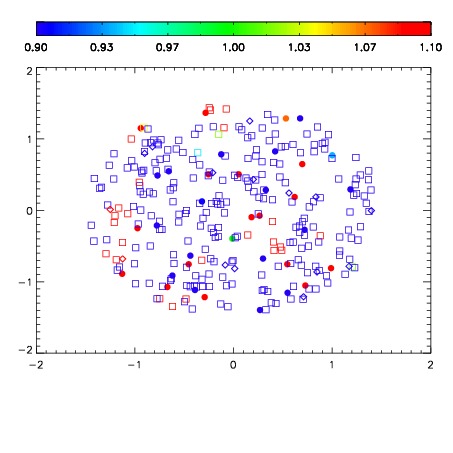
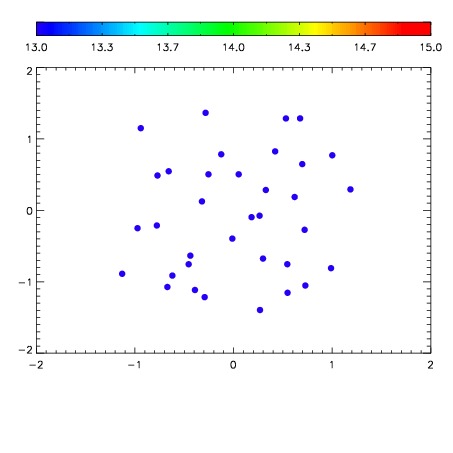

| Frame | Nreads | Zeropoints | Mag plots | Spatial mag deviation | Spatial sky 16325A emission deviations (filled: sky, open: star) | Spatial sky continuum emission | Spatial sky telluric CO2 absorption deviations (filled: H < 10) | |||||||||||||||||||||||
| 0 | 0 |
|
|
|
|
|
|
| IPAIR | NAME | SHIFT | NEWSHIFT | S/N | NAME | SHIFT | NEWSHIFT | S/N |
| 0 | 18610032 | 0.508694 | 0.00000 | 14.9607 | 18610033 | 0.00154704 | 0.507147 | 16.1719 |
| 1 | 18610027 | 0.503112 | 0.00558197 | 18.3717 | 18610026 | 0.000536695 | 0.508157 | 18.2138 |
| 2 | 18610028 | 0.504239 | 0.00445497 | 18.0631 | 18610029 | 0.000114857 | 0.508579 | 18.0773 |
| 3 | 18610023 | 0.504025 | 0.00466901 | 17.2956 | 18610030 | 0.000948762 | 0.507745 | 17.6307 |
| 4 | 18610024 | 0.505935 | 0.00275898 | 16.9570 | 18610022 | 0.00000 | 0.508694 | 17.2741 |
| 5 | 18610031 | 0.506989 | 0.00170499 | 16.8857 | 18610025 | 0.00193521 | 0.506759 | 16.9458 |