| Red | Green | Blue | |
| z | 17.64 | ||
| znorm | Inf | ||
| sky | -Inf | -Inf | -Inf |
| S/N | 18.1 | 35.8 | 40.9 |
| S/N(c) | 0.0 | 0.0 | 0.0 |
| SN(E/C) |
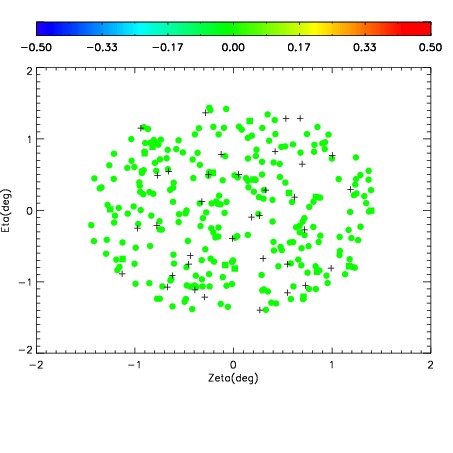
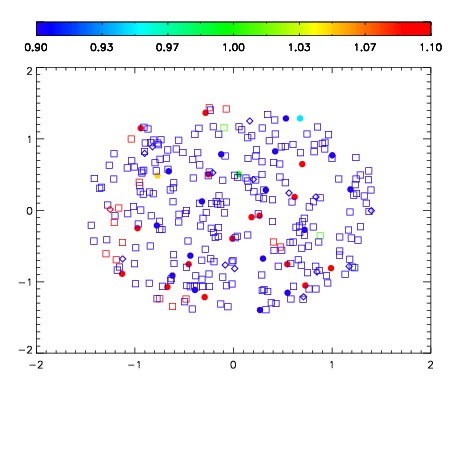
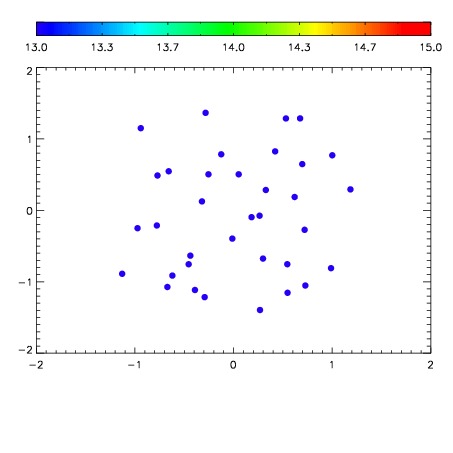

| Frame | Nreads | Zeropoints | Mag plots | Spatial mag deviation | Spatial sky 16325A emission deviations (filled: sky, open: star) | Spatial sky continuum emission | Spatial sky telluric CO2 absorption deviations (filled: H < 10) | |||||||||||||||||||||||
| 0 | 0 |
|
|
|
|
|
|
| IPAIR | NAME | SHIFT | NEWSHIFT | S/N | NAME | SHIFT | NEWSHIFT | S/N |
| 0 | 18620032 | 0.00363844 | 0.00000 | 17.7800 | 18620033 | -0.497919 | 0.501557 | 17.7681 |
| 1 | 18620035 | 0.00221079 | 0.00142765 | 18.6411 | 18620034 | -0.496872 | 0.500510 | 18.6467 |
| 2 | 18620028 | 0.000685970 | 0.00295247 | 18.5629 | 18620029 | -0.496551 | 0.500189 | 18.5344 |
| 3 | 18620031 | 0.00212219 | 0.00151625 | 18.1142 | 18620030 | -0.497045 | 0.500683 | 18.0381 |
| 4 | 18620024 | 0.00000 | 0.00363844 | 17.7385 | 18620025 | -0.498135 | 0.501773 | 17.7187 |
| 5 | 18620027 | 0.00187908 | 0.00175936 | 17.6785 | 18620026 | -0.498513 | 0.502151 | 17.6331 |