| Red | Green | Blue | |
| z | 17.64 | ||
| znorm | Inf | ||
| sky | -Inf | -Inf | -Inf |
| S/N | 13.2 | 26.7 | 32.1 |
| S/N(c) | 0.0 | 0.0 | 0.0 |
| SN(E/C) |
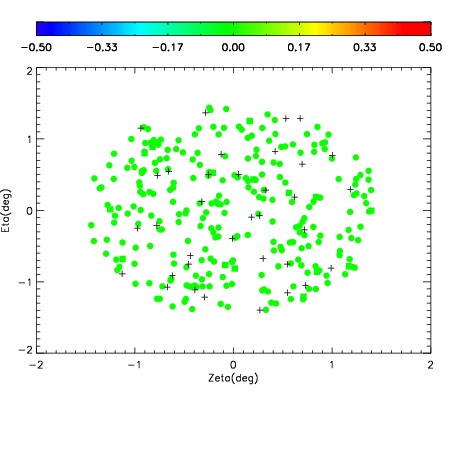
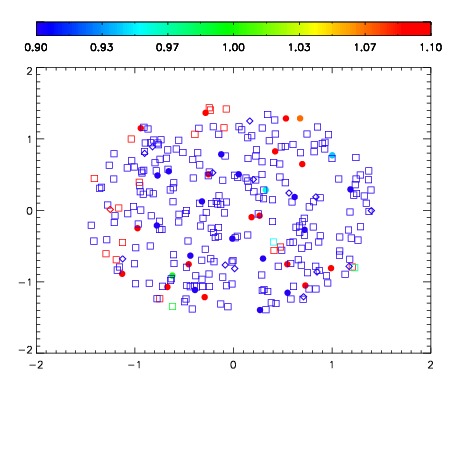
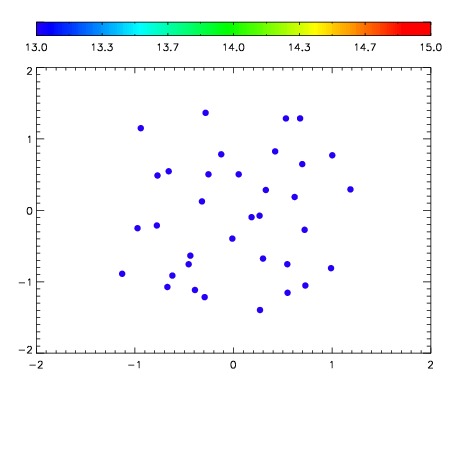

| Frame | Nreads | Zeropoints | Mag plots | Spatial mag deviation | Spatial sky 16325A emission deviations (filled: sky, open: star) | Spatial sky continuum emission | Spatial sky telluric CO2 absorption deviations (filled: H < 10) | |||||||||||||||||||||||
| 0 | 0 |
|
|
|
|
|
|
| IPAIR | NAME | SHIFT | NEWSHIFT | S/N | NAME | SHIFT | NEWSHIFT | S/N |
| 0 | 18630029 | 0.00160636 | 0.00000 | 17.6721 | 18630030 | -0.498940 | 0.500546 | 17.7629 |
| 1 | 18630025 | 0.00000 | 0.00160636 | 18.6712 | 18630026 | -0.499377 | 0.500983 | 18.6937 |
| 2 | 18630028 | 0.000184938 | 0.00142142 | 18.0121 | 18630027 | -0.498392 | 0.499998 | 17.9758 |