| Red | Green | Blue | |
| z | 17.64 | ||
| znorm | Inf | ||
| sky | -Inf | -Inf | -Inf |
| S/N | 25.9 | 47.4 | 53.6 |
| S/N(c) | 0.0 | 0.0 | 0.0 |
| SN(E/C) |
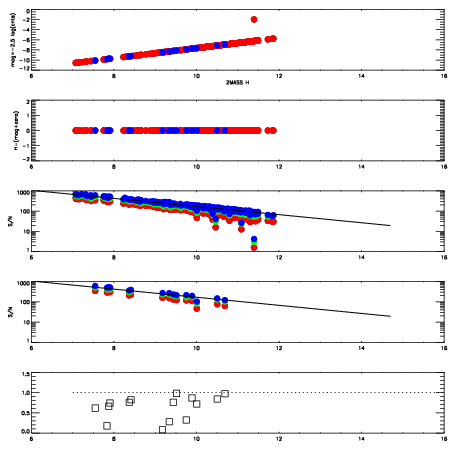
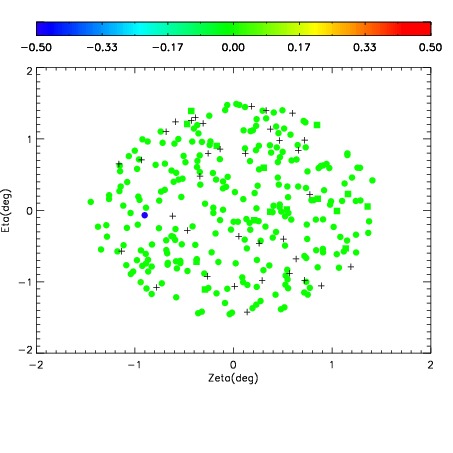
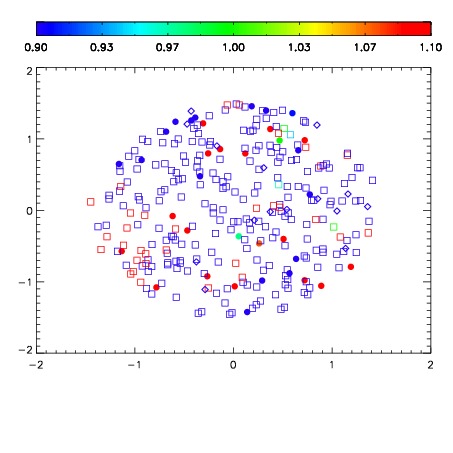
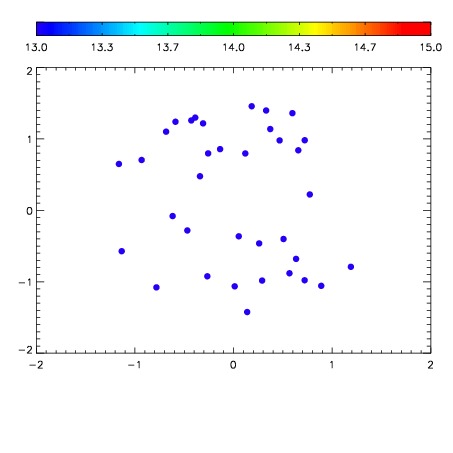

| Frame | Nreads | Zeropoints | Mag plots | Spatial mag deviation | Spatial sky 16325A emission deviations (filled: sky, open: star) | Spatial sky continuum emission | Spatial sky telluric CO2 absorption deviations (filled: H < 10) | |||||||||||||||||||||||
| 0 | 0 |
|
|
|
|
|
|
| IPAIR | NAME | SHIFT | NEWSHIFT | S/N | NAME | SHIFT | NEWSHIFT | S/N |
| 0 | 18000028 | 0.506997 | 0.00000 | 18.4564 | 18000027 | 0.00431435 | 0.502683 | 18.5516 |
| 1 | 18000021 | 0.504701 | 0.00229597 | 18.6952 | 18000022 | 0.00242113 | 0.504576 | 18.7628 |
| 2 | 18000016 | 0.501324 | 0.00567299 | 18.6341 | 18000015 | 0.00357358 | 0.503423 | 18.7189 |
| 3 | 18000025 | 0.506749 | 0.000248015 | 18.3767 | 18000026 | 0.00382600 | 0.503171 | 18.3816 |
| 4 | 18000020 | 0.504359 | 0.00263798 | 18.1618 | 18000023 | 0.00183135 | 0.505166 | 18.1996 |
| 5 | 18000024 | 0.506246 | 0.000751019 | 18.1045 | 18000019 | 0.00319024 | 0.503807 | 18.1366 |
| 6 | 18000017 | 0.502530 | 0.00446701 | 18.0122 | 18000018 | 0.00317913 | 0.503818 | 17.9969 |
| 7 | 18000012 | 0.500388 | 0.00660896 | 17.8653 | 18000014 | 0.00404218 | 0.502955 | 17.9533 |
| 8 | 18000013 | 0.501811 | 0.00518596 | 17.8609 | 18000011 | 0.00000 | 0.506997 | 17.7469 |