| Red | Green | Blue | |
| z | 17.64 | ||
| znorm | Inf | ||
| sky | -NaN | -NaN | -NaN |
| S/N | 27.8 | 51.9 | 58.4 |
| S/N(c) | 0.0 | 0.0 | 0.0 |
| SN(E/C) |
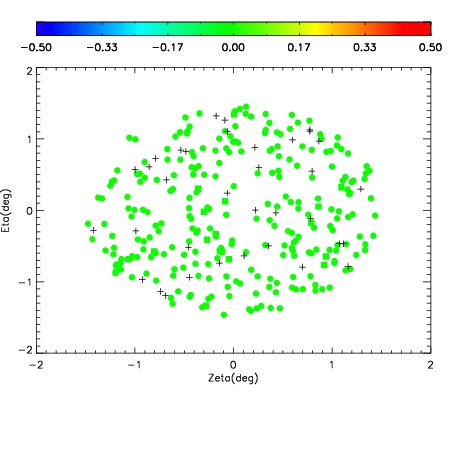
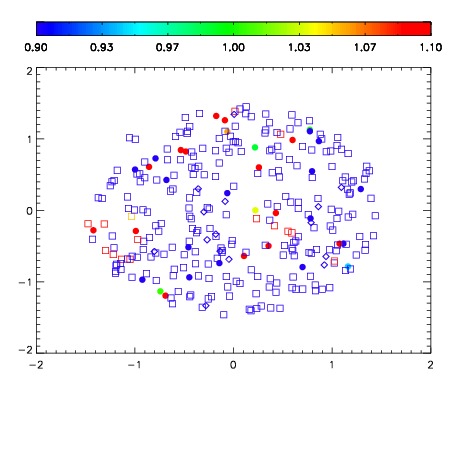
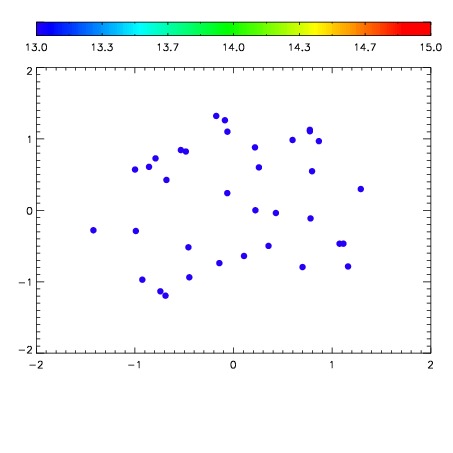

| Frame | Nreads | Zeropoints | Mag plots | Spatial mag deviation | Spatial sky 16325A emission deviations (filled: sky, open: star) | Spatial sky continuum emission | Spatial sky telluric CO2 absorption deviations (filled: H < 10) | |||||||||||||||||||||||
| 0 | 0 |
|
|
|
|
|
|
| IPAIR | NAME | SHIFT | NEWSHIFT | S/N | NAME | SHIFT | NEWSHIFT | S/N |
| 0 | 18690043 | 0.511192 | 0.00000 | 18.3022 | 18690045 | 0.000841056 | 0.510351 | 18.2899 |
| 1 | 18690027 | 0.506602 | 0.00459003 | 18.9441 | 18690026 | 0.000332190 | 0.510860 | 18.9014 |
| 2 | 18690032 | 0.504356 | 0.00683600 | 18.8368 | 18690038 | 0.000658663 | 0.510533 | 18.6687 |
| 3 | 18690039 | 0.508181 | 0.00301105 | 18.7196 | 18690033 | 0.000321017 | 0.510871 | 18.5758 |
| 4 | 18690044 | 0.510642 | 0.000550032 | 18.3849 | 18690042 | 0.00219162 | 0.509000 | 18.2900 |
| 5 | 18690040 | 0.508959 | 0.00223303 | 18.2131 | 18690041 | 0.000673306 | 0.510519 | 18.2699 |
| 6 | 18690036 | 0.510780 | 0.000412047 | 18.0989 | 18690037 | 0.00261092 | 0.508581 | 18.1159 |
| 7 | 18690035 | 0.509429 | 0.00176305 | 18.0407 | 18690034 | 0.000766941 | 0.510425 | 18.0455 |
| 8 | 18690031 | 0.506353 | 0.00483900 | 17.9514 | 18690029 | 0.00137988 | 0.509812 | 17.9639 |
| 9 | 18690028 | 0.508370 | 0.00282204 | 17.9040 | 18690030 | 0.00203482 | 0.509157 | 17.9154 |
| 10 | 18690023 | 0.506798 | 0.00439399 | 17.6200 | 18690022 | 0.00000 | 0.511192 | 17.7030 |
| 11 | 18690024 | 0.508042 | 0.00315005 | 17.5221 | 18690025 | 0.00198697 | 0.509205 | 17.6521 |