| Red | Green | Blue | |
| z | 17.64 | ||
| znorm | Inf | ||
| sky | -Inf | -Inf | -NaN |
| S/N | 28.7 | 50.6 | 59.8 |
| S/N(c) | 0.0 | 0.0 | 0.0 |
| SN(E/C) |
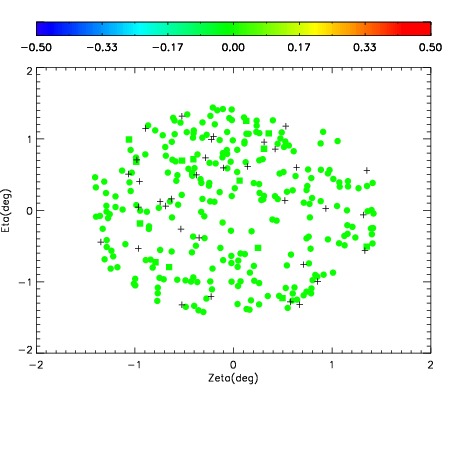
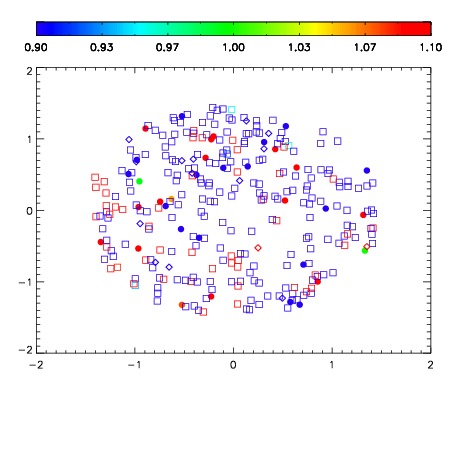
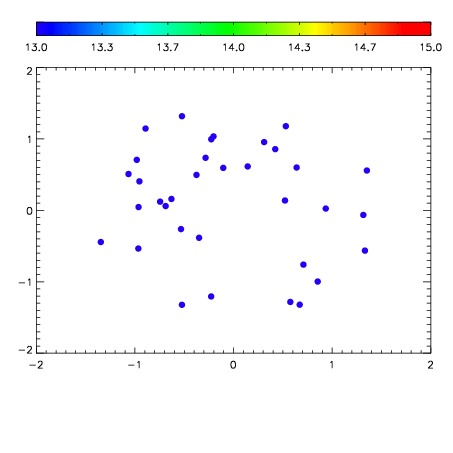

| Frame | Nreads | Zeropoints | Mag plots | Spatial mag deviation | Spatial sky 16325A emission deviations (filled: sky, open: star) | Spatial sky continuum emission | Spatial sky telluric CO2 absorption deviations (filled: H < 10) | |||||||||||||||||||||||
| 0 | 0 |
|
|
|
|
|
|
| IPAIR | NAME | SHIFT | NEWSHIFT | S/N | NAME | SHIFT | NEWSHIFT | S/N |
| 0 | 18020036 | 0.00615860 | 0.00000 | 18.2163 | 18020035 | -0.502459 | 0.508618 | 18.1773 |
| 1 | 18020025 | 0.000528098 | 0.00563050 | 18.8239 | 18020026 | -0.507837 | 0.513996 | 18.8256 |
| 2 | 18020032 | 0.00436951 | 0.00178909 | 18.5650 | 18020031 | -0.503611 | 0.509770 | 18.6391 |
| 3 | 18020037 | 0.00604350 | 0.000115100 | 18.4993 | 18020038 | -0.500389 | 0.506548 | 18.4899 |
| 4 | 18020033 | 0.00441974 | 0.00173886 | 18.3196 | 18020034 | -0.503092 | 0.509251 | 18.2801 |
| 5 | 18020028 | 0.00313697 | 0.00302163 | 18.1058 | 18020027 | -0.508111 | 0.514270 | 18.0714 |
| 6 | 18020029 | 0.00378467 | 0.00237393 | 18.0529 | 18020030 | -0.504585 | 0.510744 | 18.0215 |
| 7 | 18020024 | 6.40576e-05 | 0.00609454 | 17.9600 | 18020022 | -0.507622 | 0.513781 | 17.9168 |
| 8 | 18020021 | 0.00000 | 0.00615860 | 17.9502 | 18020023 | -0.509097 | 0.515256 | 17.8652 |