| Red | Green | Blue | |
| z | 17.64 | ||
| znorm | Inf | ||
| sky | -Inf | -Inf | -Inf |
| S/N | 23.7 | 41.7 | 47.9 |
| S/N(c) | 0.0 | 0.0 | 0.0 |
| SN(E/C) |
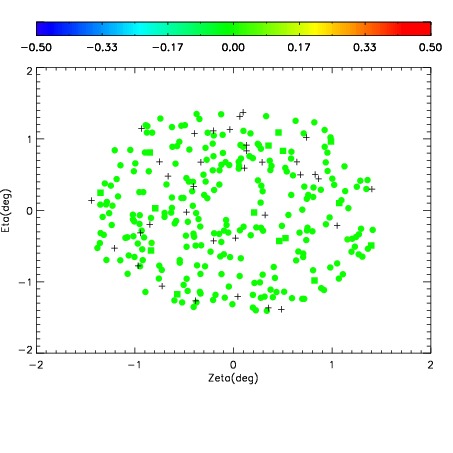
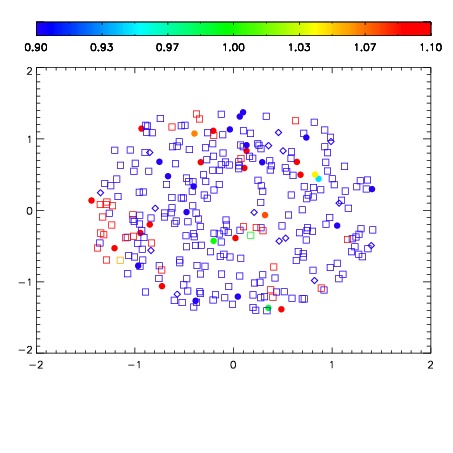
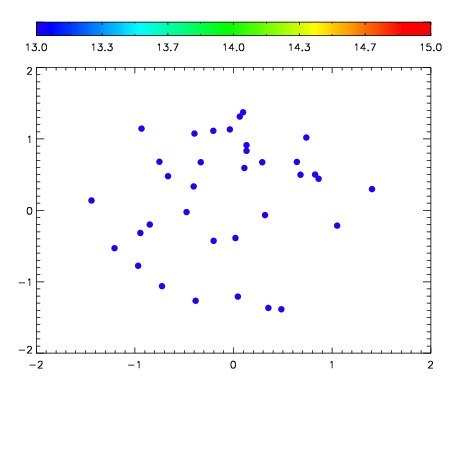

| Frame | Nreads | Zeropoints | Mag plots | Spatial mag deviation | Spatial sky 16325A emission deviations (filled: sky, open: star) | Spatial sky continuum emission | Spatial sky telluric CO2 absorption deviations (filled: H < 10) | |||||||||||||||||||||||
| 0 | 0 |
|
|
|
|
|
|
| IPAIR | NAME | SHIFT | NEWSHIFT | S/N | NAME | SHIFT | NEWSHIFT | S/N |
| 0 | 18650038 | 0.00122376 | 0.00000 | 18.0749 | 18650037 | -0.501483 | 0.502707 | 18.0934 |
| 1 | 18650039 | 0.000258441 | 0.000965319 | 18.6295 | 18650040 | -0.502878 | 0.504102 | 18.6852 |
| 2 | 18650046 | -0.00288110 | 0.00410486 | 18.4042 | 18650045 | -0.502808 | 0.504032 | 18.4879 |
| 3 | 18650042 | -0.000484140 | 0.00170790 | 18.2068 | 18650044 | -0.502768 | 0.503992 | 18.2137 |
| 4 | 18650043 | 0.000573777 | 0.000649983 | 18.1398 | 18650041 | -0.503495 | 0.504719 | 18.1466 |
| 5 | 18650035 | 0.00000 | 0.00122376 | 17.8875 | 18650036 | -0.502072 | 0.503296 | 17.9145 |