| Red | Green | Blue | |
| z | 17.64 | ||
| znorm | Inf | ||
| sky | -NaN | -NaN | -NaN |
| S/N | 15.4 | 30.5 | 31.7 |
| S/N(c) | 0.0 | 0.0 | 0.0 |
| SN(E/C) |
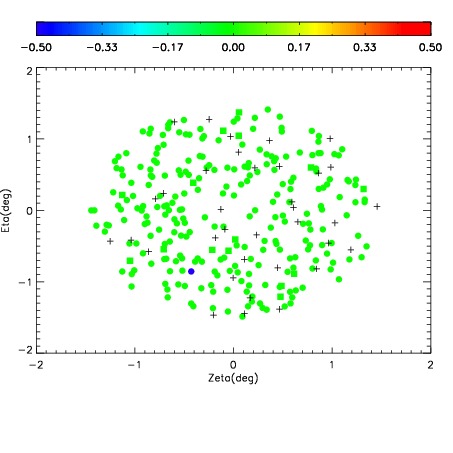
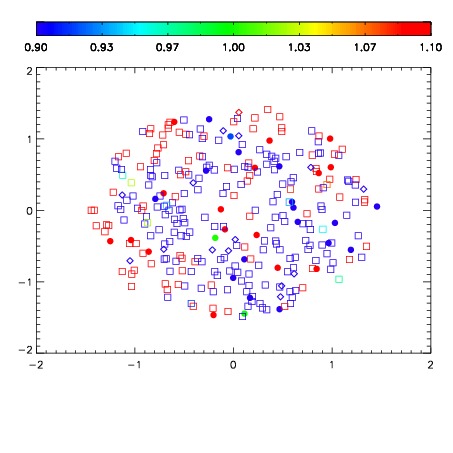


| Frame | Nreads | Zeropoints | Mag plots | Spatial mag deviation | Spatial sky 16325A emission deviations (filled: sky, open: star) | Spatial sky continuum emission | Spatial sky telluric CO2 absorption deviations (filled: H < 10) | |||||||||||||||||||||||
| 0 | 0 |
|
|
|
|
|
|
| IPAIR | NAME | SHIFT | NEWSHIFT | S/N | NAME | SHIFT | NEWSHIFT | S/N |
| 0 | 18030028 | 0.515188 | 0.00000 | 16.3317 | 18030026 | 0.00332476 | 0.511863 | 16.7127 |
| 1 | 18030016 | 0.510260 | 0.00492799 | 18.4419 | 18030015 | 0.00111204 | 0.514076 | 18.5124 |
| 2 | 18030021 | 0.511248 | 0.00393999 | 18.0627 | 18030018 | 0.00262840 | 0.512560 | 17.7321 |
| 3 | 18030020 | 0.510635 | 0.00455296 | 17.8450 | 18030014 | 0.00123155 | 0.513956 | 17.7099 |
| 4 | 18030013 | 0.511061 | 0.00412697 | 17.7980 | 18030019 | 0.00239159 | 0.512796 | 17.7051 |
| 5 | 18030017 | 0.510898 | 0.00428998 | 17.7734 | 18030022 | 0.00350973 | 0.511678 | 17.5992 |
| 6 | 18030012 | 0.510656 | 0.00453198 | 17.5785 | 18030011 | 0.00000 | 0.515188 | 17.5644 |
| 7 | 18030024 | 0.512379 | 0.00280899 | 17.3560 | 18030023 | 0.00281503 | 0.512373 | 17.5104 |
| 8 | 18030025 | 0.513479 | 0.00170898 | 16.8578 | 18030027 | 0.00298961 | 0.512198 | 16.9318 |