| Red | Green | Blue | |
| z | 17.64 | ||
| znorm | Inf | ||
| sky | -Inf | -NaN | -NaN |
| S/N | 15.2 | 31.0 | 31.4 |
| S/N(c) | 0.0 | 0.0 | 0.0 |
| SN(E/C) |
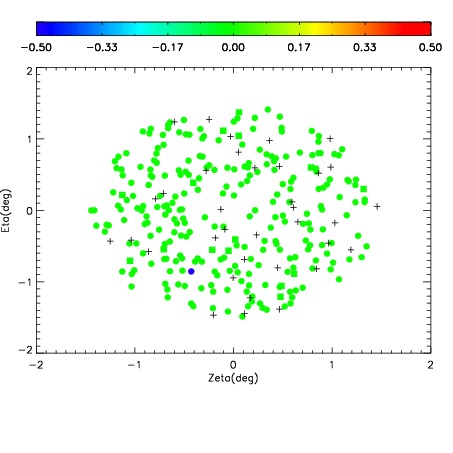
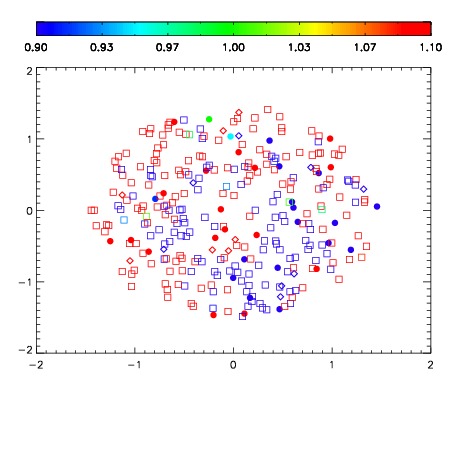
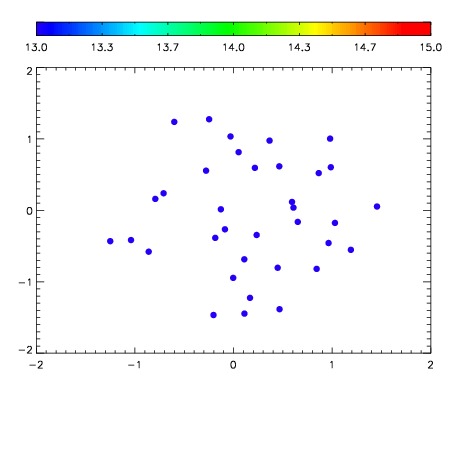

| Frame | Nreads | Zeropoints | Mag plots | Spatial mag deviation | Spatial sky 16325A emission deviations (filled: sky, open: star) | Spatial sky continuum emission | Spatial sky telluric CO2 absorption deviations (filled: H < 10) | |||||||||||||||||||||||
| 0 | 0 |
|
|
|
|
|
|
| IPAIR | NAME | SHIFT | NEWSHIFT | S/N | NAME | SHIFT | NEWSHIFT | S/N |
| 0 | 18040015 | 0.510205 | 0.00000 | 16.1425 | 18040016 | -0.000566578 | 0.510772 | 15.9366 |
| 1 | 18040034 | 0.509929 | 0.000275970 | 17.8212 | 18040029 | 0.00246143 | 0.507744 | 17.8239 |
| 2 | 18040035 | 0.509841 | 0.000363946 | 17.7243 | 18040033 | 0.00646136 | 0.503744 | 17.8148 |
| 3 | 18040030 | 0.508790 | 0.00141495 | 17.7060 | 18040036 | 0.00583217 | 0.504373 | 17.7780 |
| 4 | 18040031 | 0.509431 | 0.000773966 | 17.6590 | 18040032 | 0.00637519 | 0.503830 | 17.7480 |
| 5 | 18040026 | 0.506887 | 0.00331795 | 17.6030 | 18040025 | -0.000836190 | 0.511041 | 17.4459 |
| 6 | 18040027 | 0.507915 | 0.00228995 | 17.4060 | 18040024 | -0.000834763 | 0.511040 | 17.4372 |
| 7 | 18040022 | 0.504578 | 0.00562698 | 17.3086 | 18040028 | 0.00203579 | 0.508169 | 17.3951 |
| 8 | 18040023 | 0.505768 | 0.00443697 | 17.2427 | 18040020 | 0.000158769 | 0.510046 | 17.3730 |
| 9 | 18040019 | 0.504459 | 0.00574595 | 17.1365 | 18040021 | 0.000179070 | 0.510026 | 17.1895 |
| 10 | 18040018 | 0.503779 | 0.00642598 | 16.9977 | 18040017 | -0.000959239 | 0.511164 | 16.9711 |