| Red | Green | Blue | |
| z | 17.64 | ||
| znorm | Inf | ||
| sky | -NaN | -NaN | -NaN |
| S/N | 16.9 | 31.8 | 34.4 |
| S/N(c) | 0.0 | 0.0 | 0.0 |
| SN(E/C) |
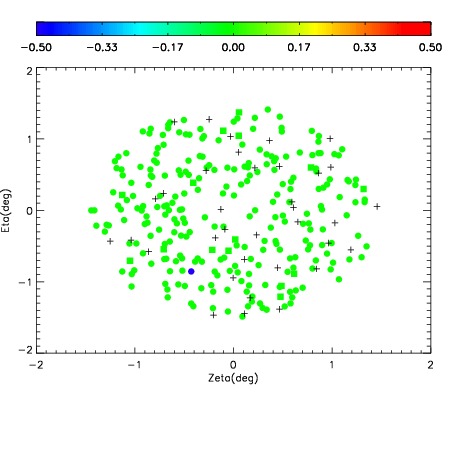
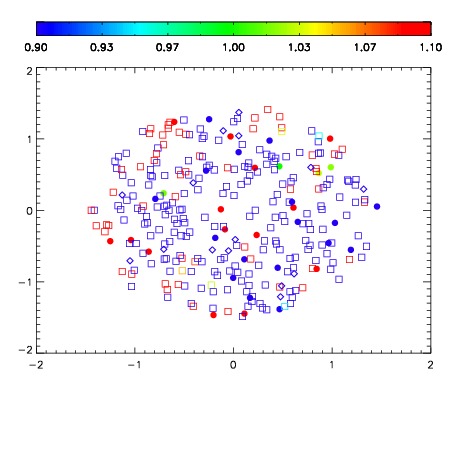
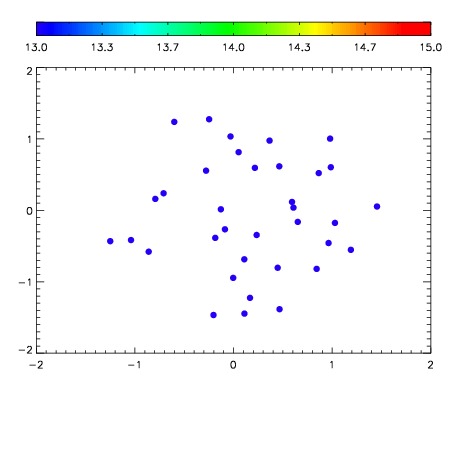

| Frame | Nreads | Zeropoints | Mag plots | Spatial mag deviation | Spatial sky 16325A emission deviations (filled: sky, open: star) | Spatial sky continuum emission | Spatial sky telluric CO2 absorption deviations (filled: H < 10) | |||||||||||||||||||||||
| 0 | 0 |
|
|
|
|
|
|
| IPAIR | NAME | SHIFT | NEWSHIFT | S/N | NAME | SHIFT | NEWSHIFT | S/N |
| 0 | 18050020 | 0.515074 | 0.00000 | 18.6554 | 18050021 | 0.00632047 | 0.508754 | 18.5574 |
| 1 | 18050019 | 0.513869 | 0.00120503 | 18.7664 | 18050018 | 0.00934971 | 0.505724 | 18.6538 |
| 2 | 18050016 | 0.514491 | 0.000582993 | 17.8844 | 18050017 | 0.00868524 | 0.506389 | 17.9485 |
| 3 | 18050015 | 0.513586 | 0.00148803 | 17.7201 | 18050014 | 0.00000 | 0.515074 | 17.6869 |