| Red | Green | Blue | |
| z | 17.64 | ||
| znorm | Inf | ||
| sky | -Inf | -Inf | -NaN |
| S/N | 11.8 | 22.4 | 25.8 |
| S/N(c) | 0.0 | 0.0 | 0.0 |
| SN(E/C) |
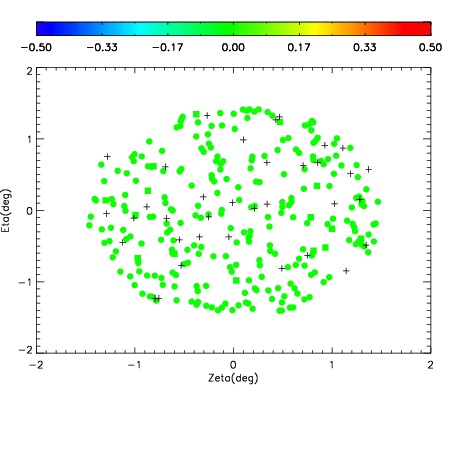

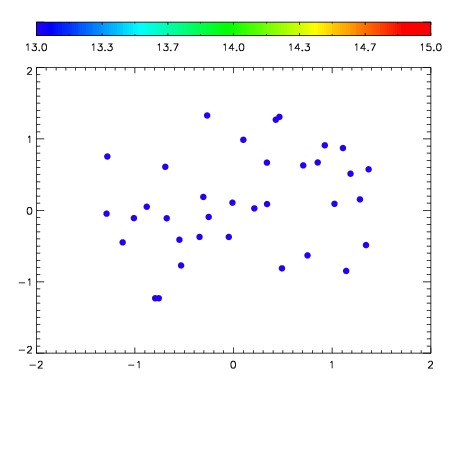

| Frame | Nreads | Zeropoints | Mag plots | Spatial mag deviation | Spatial sky 16325A emission deviations (filled: sky, open: star) | Spatial sky continuum emission | Spatial sky telluric CO2 absorption deviations (filled: H < 10) | |||||||||||||||||||||||
| 0 | 0 |
|
|
|
|
|
|
| IPAIR | NAME | SHIFT | NEWSHIFT | S/N | NAME | SHIFT | NEWSHIFT | S/N |
| 0 | 17780043 | 0.00129619 | 0.00000 | 16.1824 | 17780042 | -0.508482 | 0.509778 | 16.3680 |
| 1 | 17780036 | 0.00000 | 0.00129619 | 18.1834 | 17780038 | -0.508463 | 0.509759 | 18.1457 |
| 2 | 17780039 | -0.000728984 | 0.00202517 | 17.9697 | 17780037 | -0.508472 | 0.509768 | 18.1165 |
| 3 | 17780040 | 0.000130553 | 0.00116564 | 17.2341 | 17780041 | -0.508298 | 0.509594 | 17.0436 |