| Red | Green | Blue | |
| z | 17.64 | ||
| znorm | Inf | ||
| sky | -NaN | -Inf | -NaN |
| S/N | 26.6 | 50.1 | 60.1 |
| S/N(c) | 0.0 | 0.0 | 0.0 |
| SN(E/C) |
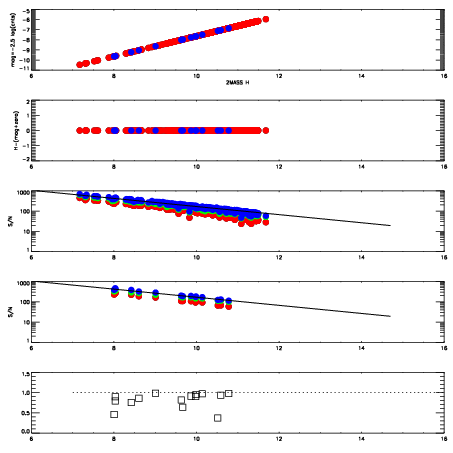
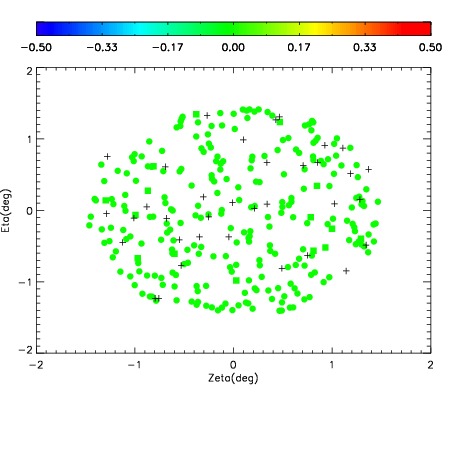
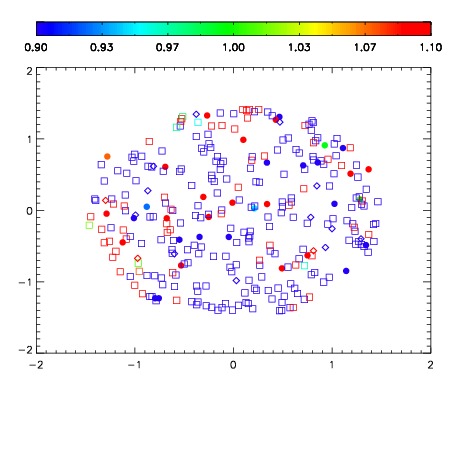
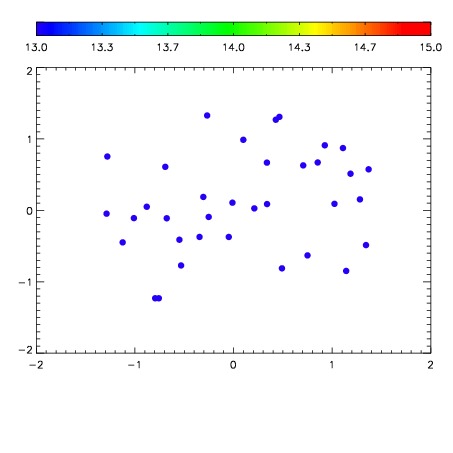

| Frame | Nreads | Zeropoints | Mag plots | Spatial mag deviation | Spatial sky 16325A emission deviations (filled: sky, open: star) | Spatial sky continuum emission | Spatial sky telluric CO2 absorption deviations (filled: H < 10) | |||||||||||||||||||||||
| 0 | 0 |
|
|
|
|
|
|
| IPAIR | NAME | SHIFT | NEWSHIFT | S/N | NAME | SHIFT | NEWSHIFT | S/N |
| 0 | 18630051 | 0.502106 | 0.00000 | 18.0284 | 18630050 | 0.00290283 | 0.499203 | 18.0346 |
| 1 | 18630039 | 0.500496 | 0.00161004 | 18.3535 | 18630038 | 0.00137407 | 0.500732 | 18.4238 |
| 2 | 18630043 | 0.501403 | 0.000703037 | 18.3240 | 18630046 | 0.00122132 | 0.500885 | 18.3759 |
| 3 | 18630040 | 0.500283 | 0.00182301 | 18.3169 | 18630049 | 0.00288594 | 0.499220 | 18.3681 |
| 4 | 18630048 | 0.501311 | 0.000795007 | 18.2963 | 18630041 | 0.00246525 | 0.499641 | 18.2907 |
| 5 | 18630047 | 0.499898 | 0.00220802 | 18.2441 | 18630042 | 0.00296878 | 0.499137 | 18.2696 |
| 6 | 18630044 | 0.501589 | 0.000517011 | 18.1939 | 18630034 | 0.00000 | 0.502106 | 18.2304 |
| 7 | 18630036 | 0.501279 | 0.000827014 | 18.1300 | 18630037 | 0.00164334 | 0.500463 | 18.1601 |
| 8 | 18630035 | 0.500011 | 0.00209498 | 18.1010 | 18630045 | 0.00240892 | 0.499697 | 18.1200 |