| Red | Green | Blue | |
| z | 17.64 | ||
| znorm | Inf | ||
| sky | -Inf | -Inf | -Inf |
| S/N | 20.6 | 35.8 | 41.4 |
| S/N(c) | 0.0 | 0.0 | 0.0 |
| SN(E/C) |
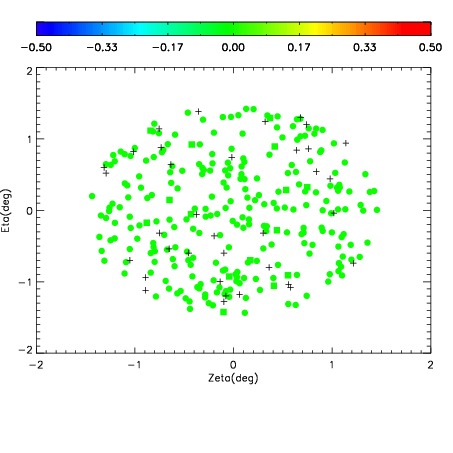
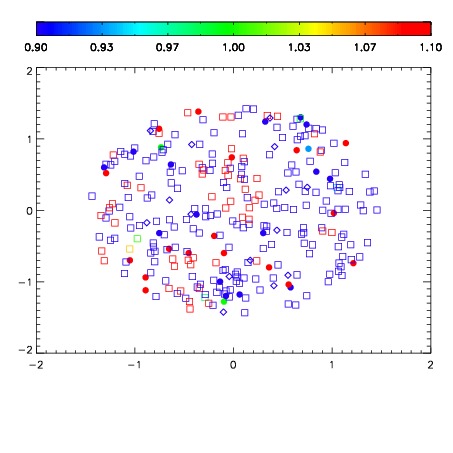
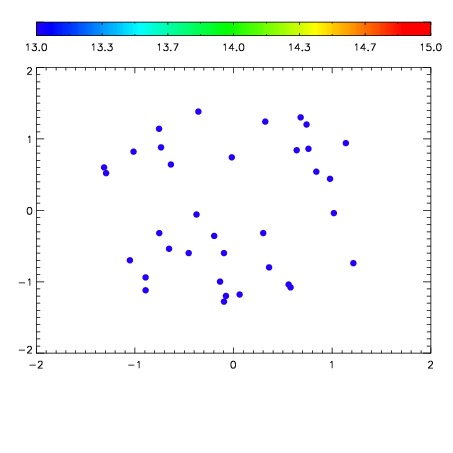

| Frame | Nreads | Zeropoints | Mag plots | Spatial mag deviation | Spatial sky 16325A emission deviations (filled: sky, open: star) | Spatial sky continuum emission | Spatial sky telluric CO2 absorption deviations (filled: H < 10) | |||||||||||||||||||||||
| 0 | 0 |
|
|
|
|
|
|
| IPAIR | NAME | SHIFT | NEWSHIFT | S/N | NAME | SHIFT | NEWSHIFT | S/N |
| 0 | 17740016 | 0.518308 | 0.00000 | 18.3632 | 17740017 | 0.00420435 | 0.514104 | 18.4072 |
| 1 | 17740015 | 0.517224 | 0.00108397 | 18.6764 | 17740014 | 0.00230382 | 0.516004 | 18.6719 |
| 2 | 17740011 | 0.515720 | 0.00258797 | 18.3400 | 17740010 | 0.00000 | 0.518308 | 18.3424 |
| 3 | 17740012 | 0.516431 | 0.00187701 | 18.2418 | 17740013 | 0.00190024 | 0.516408 | 18.1649 |