| Red | Green | Blue | |
| z | 17.64 | ||
| znorm | Inf | ||
| sky | -Inf | -Inf | -Inf |
| S/N | 16.0 | 29.2 | 33.3 |
| S/N(c) | 0.0 | 0.0 | 0.0 |
| SN(E/C) |
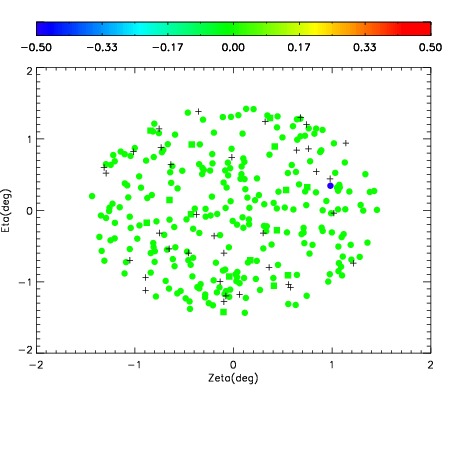
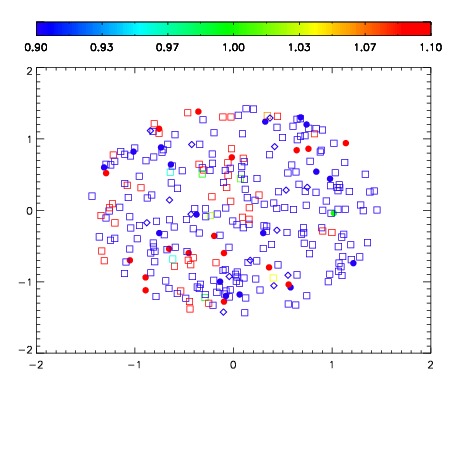
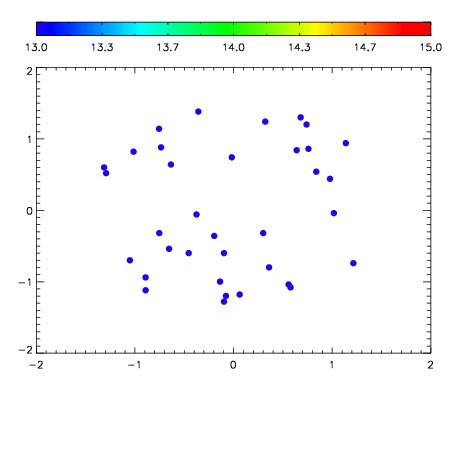

| Frame | Nreads | Zeropoints | Mag plots | Spatial mag deviation | Spatial sky 16325A emission deviations (filled: sky, open: star) | Spatial sky continuum emission | Spatial sky telluric CO2 absorption deviations (filled: H < 10) | |||||||||||||||||||||||
| 0 | 0 |
|
|
|
|
|
|
| IPAIR | NAME | SHIFT | NEWSHIFT | S/N | NAME | SHIFT | NEWSHIFT | S/N |
| 0 | 17760018 | 0.516467 | 0.00000 | 17.7967 | 17760019 | 0.00779217 | 0.508675 | 17.6720 |
| 1 | 17760013 | 0.512905 | 0.00356197 | 18.4790 | 17760015 | 0.00499094 | 0.511476 | 18.1928 |
| 2 | 17760014 | 0.515237 | 0.00123000 | 18.0966 | 17760012 | 0.00000 | 0.516467 | 18.1877 |
| 3 | 17760017 | 0.515466 | 0.00100100 | 17.8422 | 17760016 | 0.00463239 | 0.511835 | 17.9576 |