| Red | Green | Blue | |
| z | 17.64 | ||
| znorm | Inf | ||
| sky | -Inf | -Inf | -Inf |
| S/N | 16.6 | 28.8 | 33.4 |
| S/N(c) | 0.0 | 0.0 | 0.0 |
| SN(E/C) |
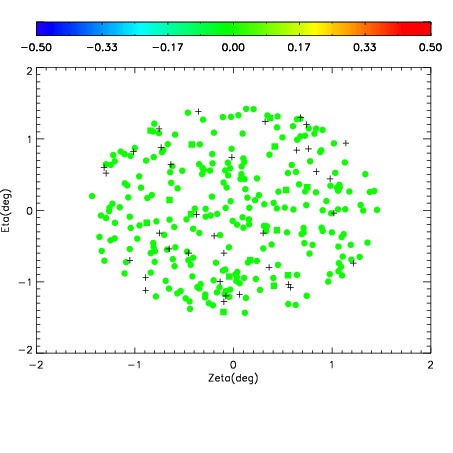
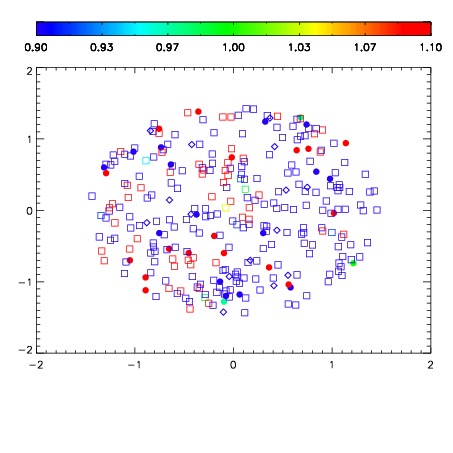


| Frame | Nreads | Zeropoints | Mag plots | Spatial mag deviation | Spatial sky 16325A emission deviations (filled: sky, open: star) | Spatial sky continuum emission | Spatial sky telluric CO2 absorption deviations (filled: H < 10) | |||||||||||||||||||||||
| 0 | 0 |
|
|
|
|
|
|
| IPAIR | NAME | SHIFT | NEWSHIFT | S/N | NAME | SHIFT | NEWSHIFT | S/N |
| 0 | 17770016 | 0.515800 | 0.00000 | 17.6517 | 17770015 | 0.00215124 | 0.513649 | 17.8711 |
| 1 | 17770012 | 0.513200 | 0.00260001 | 18.7328 | 17770011 | 0.00000 | 0.515800 | 18.4525 |
| 2 | 17770013 | 0.514586 | 0.00121403 | 18.4099 | 17770014 | 0.00216167 | 0.513638 | 18.2652 |