| Red | Green | Blue | |
| z | 17.64 | ||
| znorm | Inf | ||
| sky | -Inf | -Inf | -Inf |
| S/N | 26.7 | 47.3 | 54.4 |
| S/N(c) | 0.0 | 0.0 | 0.0 |
| SN(E/C) |
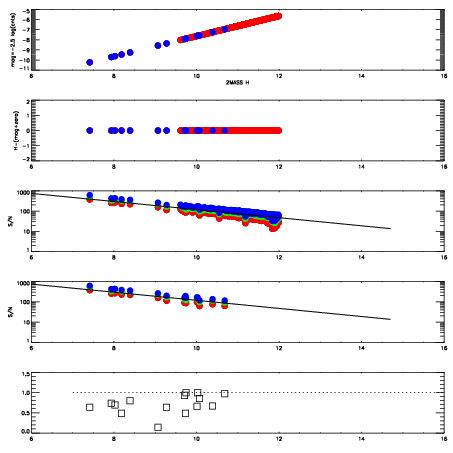
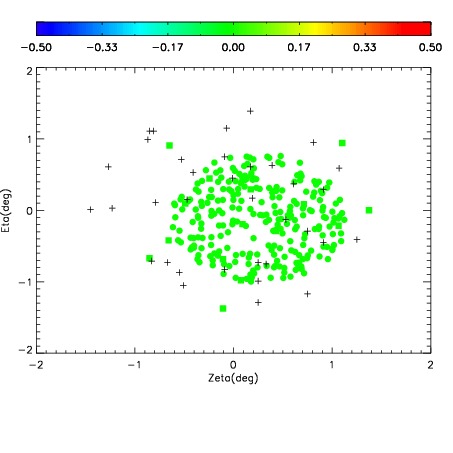
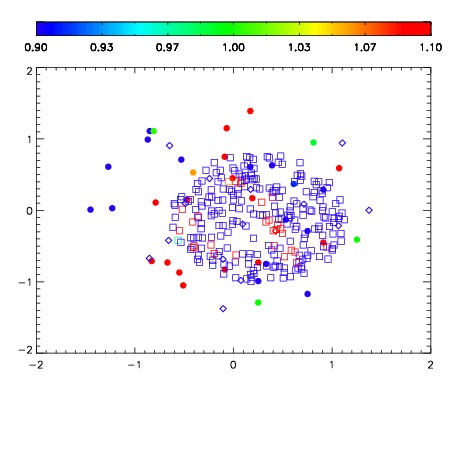
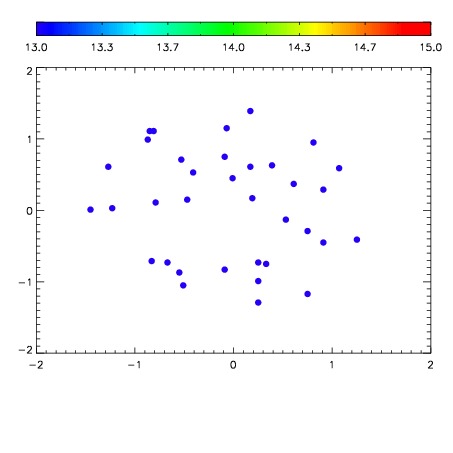

| Frame | Nreads | Zeropoints | Mag plots | Spatial mag deviation | Spatial sky 16325A emission deviations (filled: sky, open: star) | Spatial sky continuum emission | Spatial sky telluric CO2 absorption deviations (filled: H < 10) | |||||||||||||||||||||||
| 0 | 0 |
|
|
|
|
|
|
| IPAIR | NAME | SHIFT | NEWSHIFT | S/N | NAME | SHIFT | NEWSHIFT | S/N |
| 0 | 17960028 | 0.507277 | 0.00000 | 18.8948 | 17960029 | 0.00116936 | 0.506108 | 18.8433 |
| 1 | 17960024 | 0.506306 | 0.000971019 | 19.0459 | 17960022 | 0.00000 | 0.507277 | 18.9955 |
| 2 | 17960023 | 0.505413 | 0.00186402 | 19.0180 | 17960025 | 0.00227720 | 0.505000 | 18.9541 |
| 3 | 17960027 | 0.505755 | 0.00152200 | 18.9516 | 17960026 | 0.00185321 | 0.505424 | 18.9513 |