| Red | Green | Blue | |
| z | 17.64 | ||
| znorm | Inf | ||
| sky | -Inf | -Inf | -Inf |
| S/N | 15.5 | 27.9 | 33.4 |
| S/N(c) | 0.0 | 0.0 | 0.0 |
| SN(E/C) |
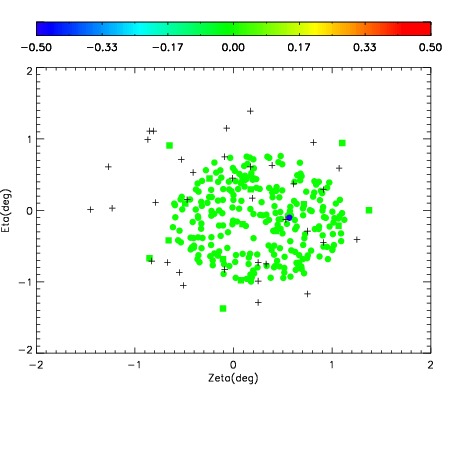
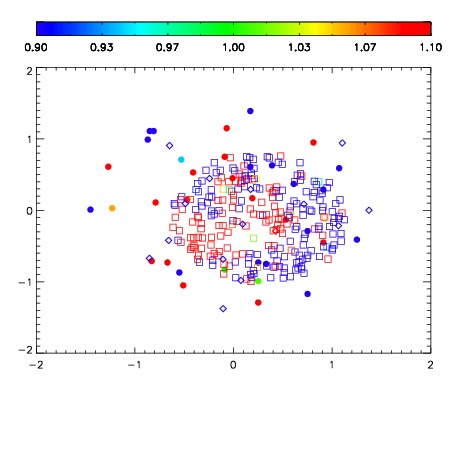
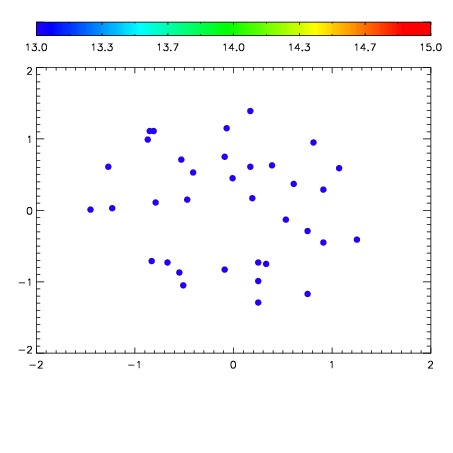

| Frame | Nreads | Zeropoints | Mag plots | Spatial mag deviation | Spatial sky 16325A emission deviations (filled: sky, open: star) | Spatial sky continuum emission | Spatial sky telluric CO2 absorption deviations (filled: H < 10) | |||||||||||||||||||||||
| 0 | 0 |
|
|
|
|
|
|
| IPAIR | NAME | SHIFT | NEWSHIFT | S/N | NAME | SHIFT | NEWSHIFT | S/N |
| 0 | 18440035 | 0.507305 | 0.00000 | 18.3844 | 18440040 | 0.00551830 | 0.501787 | 18.4467 |
| 1 | 18440039 | 0.506920 | 0.000385046 | 18.6129 | 18440036 | 0.00475218 | 0.502553 | 18.6360 |
| 2 | 18440034 | 0.507116 | 0.000189006 | 18.3555 | 18440033 | 0.00000 | 0.507305 | 18.3688 |
| 3 | 18440038 | 0.507220 | 8.50558e-05 | 16.7334 | 18440037 | 0.00531502 | 0.501990 | 17.6384 |