| Red | Green | Blue | |
| z | 17.65 | ||
| znorm | Inf | ||
| sky | -Inf | -Inf | -Inf |
| S/N | 18.4 | 33.4 | 36.1 |
| S/N(c) | 9.7 | 21.4 | 74.2 |
| SN(E/C) |
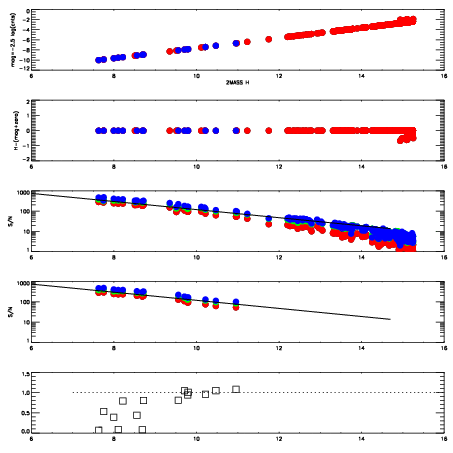
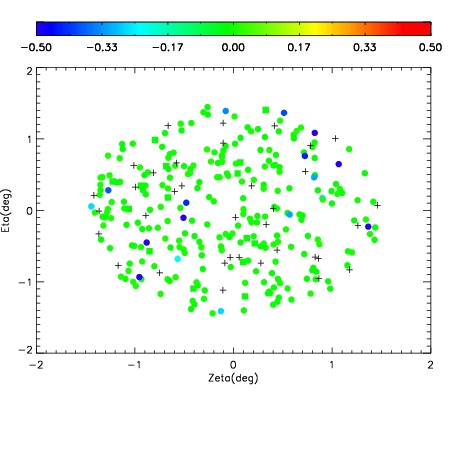
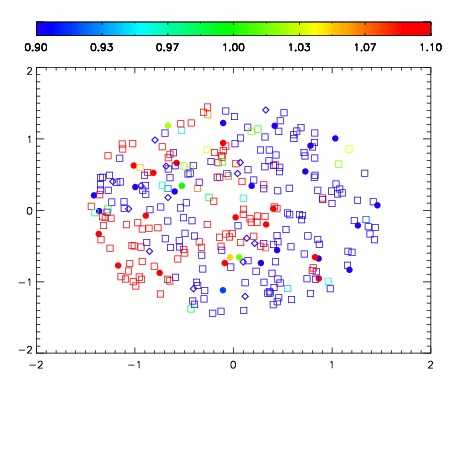
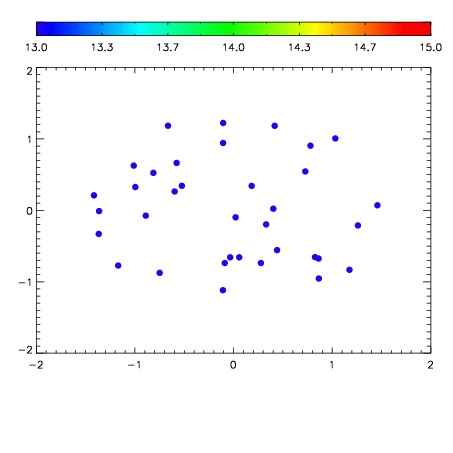

| Frame | Nreads | Zeropoints | Mag plots | Spatial mag deviation | Spatial sky 16325A emission deviations (filled: sky, open: star) | Spatial sky continuum emission | Spatial sky telluric CO2 absorption deviations (filled: H < 10) | |||||||||||||||||||||||
| 0 | 0 |
|
|
|
|
|
|
| IPAIR | NAME | SHIFT | NEWSHIFT | S/N | NAME | SHIFT | NEWSHIFT | S/N |
| 0 | 17950042 | 0.00319959 | 0.00000 | 18.8814 | 17950041 | -0.499555 | 0.502755 | 18.9958 |
| 1 | 17950035 | 0.00000 | 0.00319959 | 18.9161 | 17950036 | -0.500708 | 0.503908 | 19.1142 |
| 2 | 17950038 | 0.00114373 | 0.00205586 | 18.8888 | 17950037 | -0.500307 | 0.503507 | 19.0477 |
| 3 | 17950039 | 0.00150743 | 0.00169216 | 18.6563 | 17950040 | -0.499531 | 0.502731 | 18.7807 |