| Red | Green | Blue | |
| z | 17.67 | ||
| znorm | Inf | ||
| sky | -Inf | -Inf | -Inf |
| S/N | 25.3 | 43.1 | 44.7 |
| S/N(c) | 35.5 | 18.0 | 65.6 |
| SN(E/C) |
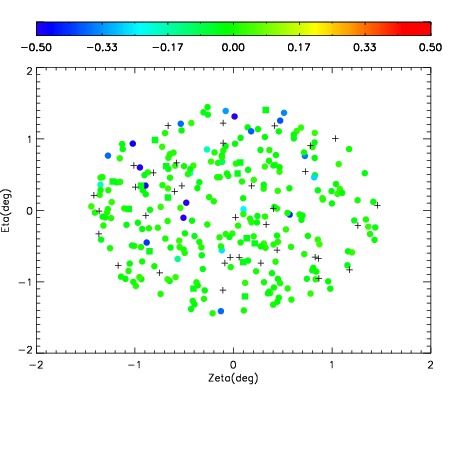
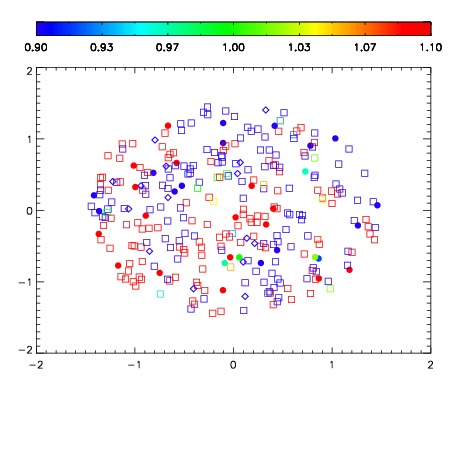


| Frame | Nreads | Zeropoints | Mag plots | Spatial mag deviation | Spatial sky 16325A emission deviations (filled: sky, open: star) | Spatial sky continuum emission | Spatial sky telluric CO2 absorption deviations (filled: H < 10) | |||||||||||||||||||||||
| 0 | 0 |
|
|
|
|
|
|
| IPAIR | NAME | SHIFT | NEWSHIFT | S/N | NAME | SHIFT | NEWSHIFT | S/N |
| 0 | 17970014 | 0.509547 | 0.00000 | 18.8077 | 17970019 | 0.00297435 | 0.506573 | 18.7357 |
| 1 | 17970018 | 0.508641 | 0.000905991 | 18.8501 | 17970012 | 0.00000 | 0.509547 | 19.0045 |
| 2 | 17970013 | 0.509374 | 0.000172973 | 18.8489 | 17970016 | 0.000858429 | 0.508689 | 18.8483 |
| 3 | 17970017 | 0.508271 | 0.00127602 | 18.8312 | 17970015 | 0.000793941 | 0.508753 | 18.8195 |