| Red | Green | Blue | |
| z | 17.65 | ||
| znorm | Inf | ||
| sky | -Inf | -Inf | -NaN |
| S/N | 22.1 | 38.4 | 43.1 |
| S/N(c) | 30.6 | 15.9 | 60.4 |
| SN(E/C) |
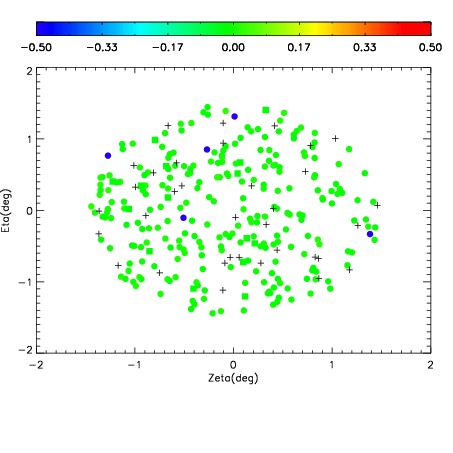
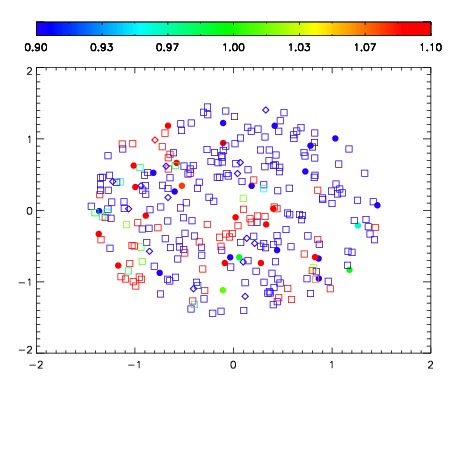
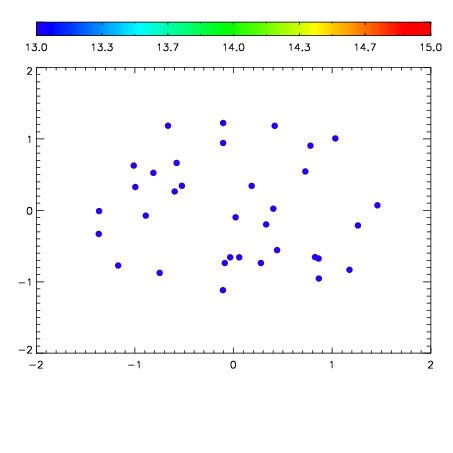

| Frame | Nreads | Zeropoints | Mag plots | Spatial mag deviation | Spatial sky 16325A emission deviations (filled: sky, open: star) | Spatial sky continuum emission | Spatial sky telluric CO2 absorption deviations (filled: H < 10) | |||||||||||||||||||||||
| 0 | 0 |
|
|
|
|
|
|
| IPAIR | NAME | SHIFT | NEWSHIFT | S/N | NAME | SHIFT | NEWSHIFT | S/N |
| 0 | 18470043 | 0.501613 | 0.00000 | 18.5766 | 18470044 | 0.00776171 | 0.493851 | 18.5898 |
| 1 | 18470034 | 0.500648 | 0.000964999 | 18.9823 | 18470033 | 0.00000 | 0.501613 | 19.0090 |
| 2 | 18470035 | 0.500971 | 0.000642002 | 18.9565 | 18470037 | 0.00219574 | 0.499417 | 18.9679 |
| 3 | 18470038 | 0.501190 | 0.000423014 | 18.8382 | 18470036 | 0.00154911 | 0.500064 | 18.9203 |
| 4 | 18470039 | 0.501483 | 0.000129998 | 18.7602 | 18470040 | 0.00322312 | 0.498390 | 18.7667 |
| 5 | 18470042 | 0.500555 | 0.00105804 | 18.7271 | 18470041 | 0.00252738 | 0.499086 | 18.7484 |