| Frame | Nreads | Zeropoints | Mag plots
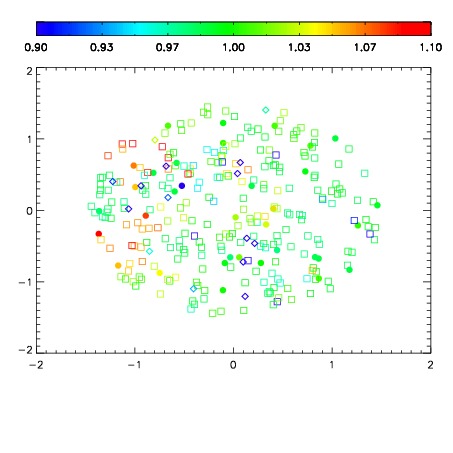
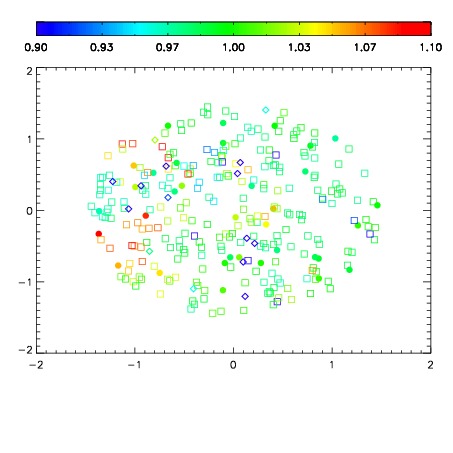
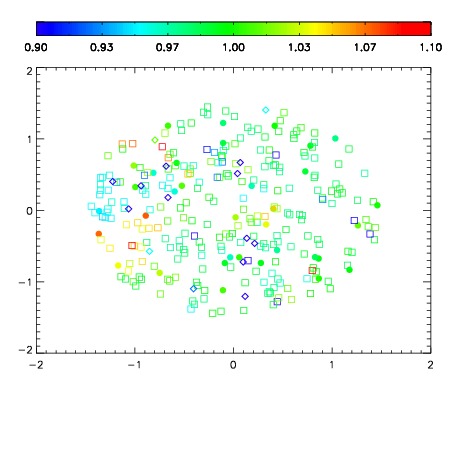
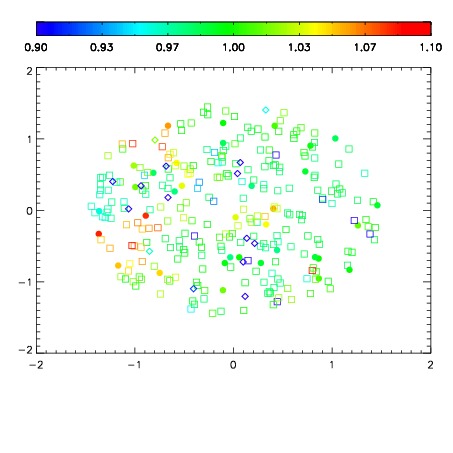
| Spatial mag deviation
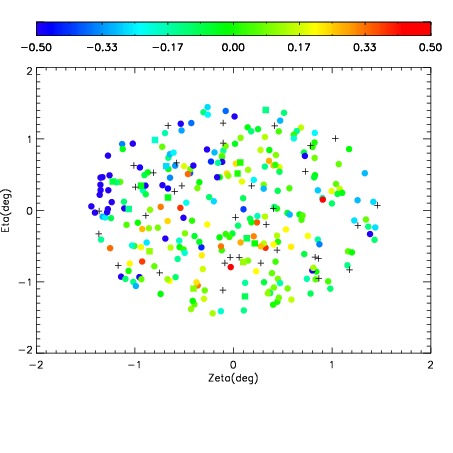
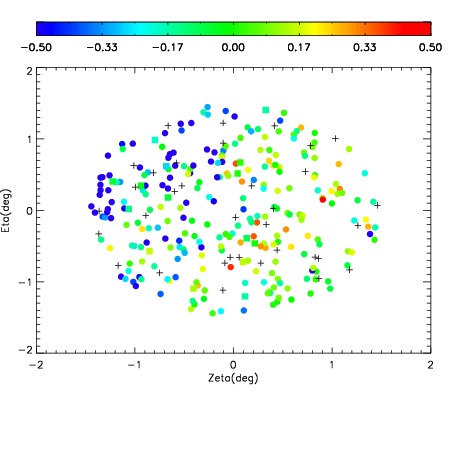
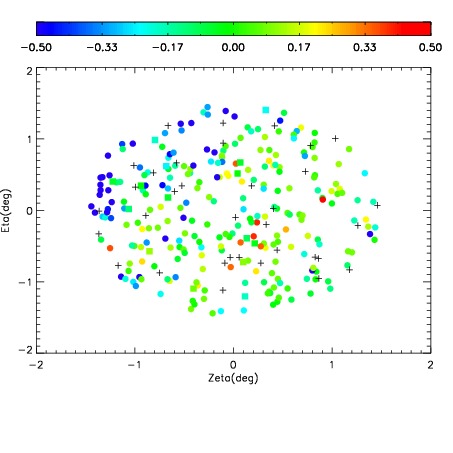
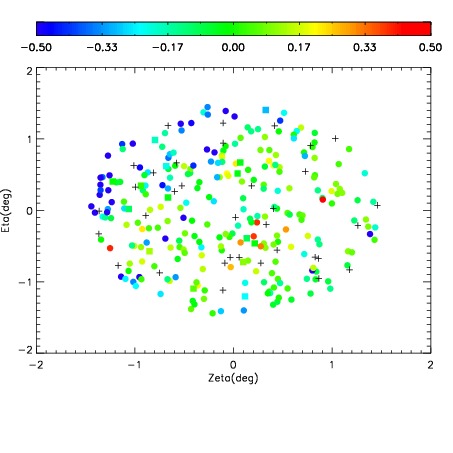
| Spatial sky 16325A emission deviations (filled: sky, open: star)
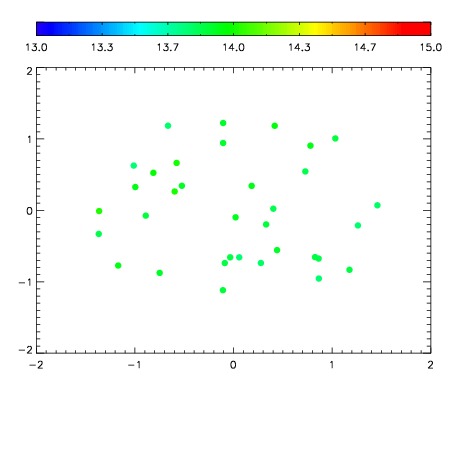
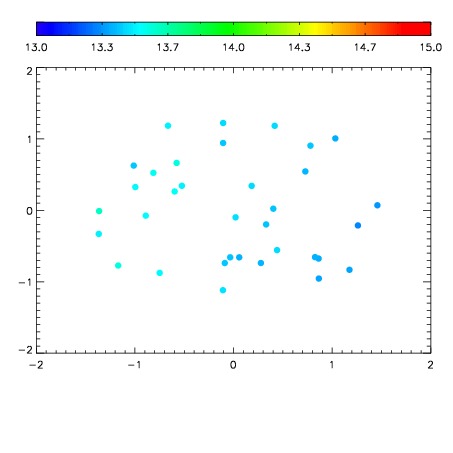
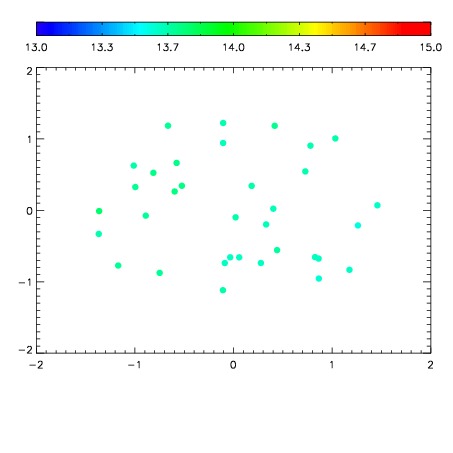
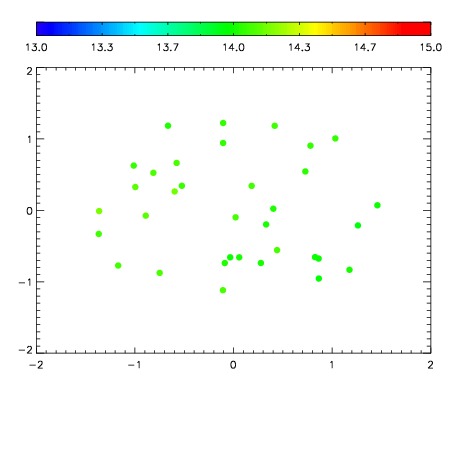
| Spatial sky continuum emission
| Spatial sky telluric CO2 absorption deviations (filled: H < 10)
|
| 18480022
| 94
| | Red | Green | Blue
| | z | | 19.71
| | znorm | | 14.78
| | sky | 14.1 | 13.9 | 13.8
| | S/N | 20.3 | 28.9 | 33.1
| | S/N(c) | 43.9 | 20.2 | 72.9
| | SN(E/C) 0.78
|
| 
| 
| 
| 
| 
|
| 18480023
| 94
| | Red | Green | Blue
| | z | | 19.54
| | znorm | | 14.60
| | sky | 13.6 | 13.4 | 13.2
| | S/N | 17.2 | 24.9 | 28.5
| | S/N(c) | 40.2 | 18.9 | 68.3
| | SN(E/C) 0.88
|
| 
| 
| 
| 
| 
|
| 18480024
| 94
| | Red | Green | Blue
| | z | | 19.65
| | znorm | | 14.72
| | sky | 13.8 | 13.7 | 13.5
| | S/N | 18.4 | 26.7 | 30.6
| | S/N(c) | 43.1 | 20.2 | 73.5
| | SN(E/C) 0.82
|
| 
| 
| 
| 
| 
|
| 18480025
| 94
| | Red | Green | Blue
| | z | | 19.70
| | znorm | | 14.76
| | sky | 14.2 | 14.1 | 13.9
| | S/N | 19.2 | 28.0 | 32.0
| | S/N(c) | 44.4 | 20.9 | 75.2
| | SN(E/C) 0.83
|
| 
| 
| 
| 
| 
|