| Red | Green | Blue | |
| z | 17.65 | ||
| znorm | Inf | ||
| sky | -Inf | -Inf | -NaN |
| S/N | 24.2 | 35.6 | 41.3 |
| S/N(c) | 28.3 | 13.4 | 50.1 |
| SN(E/C) |
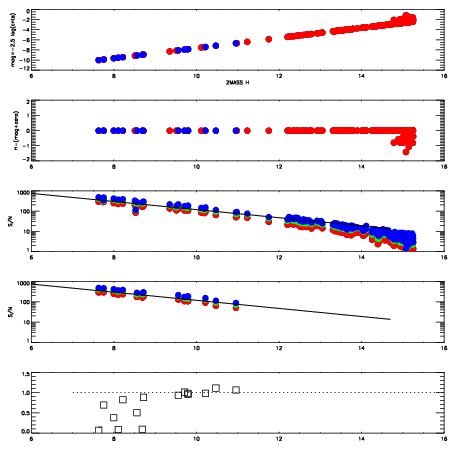
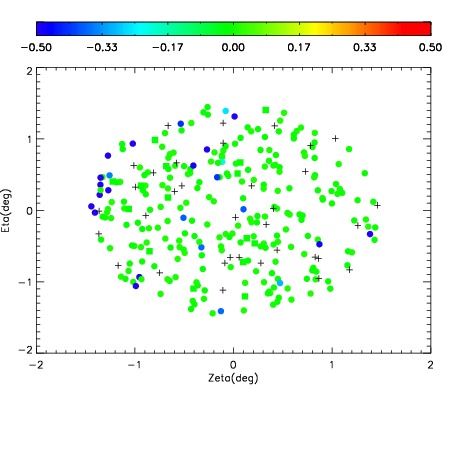
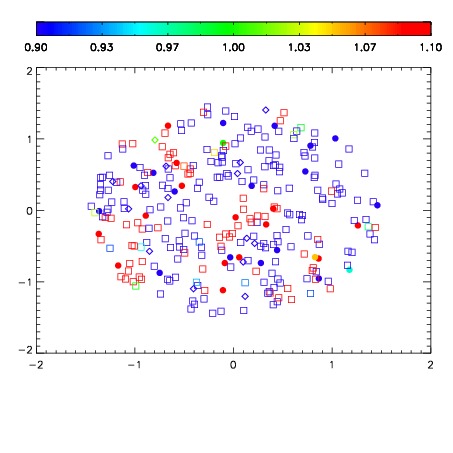


| Frame | Nreads | Zeropoints | Mag plots | Spatial mag deviation | Spatial sky 16325A emission deviations (filled: sky, open: star) | Spatial sky continuum emission | Spatial sky telluric CO2 absorption deviations (filled: H < 10) | |||||||||||||||||||||||
| 0 | 0 |
|
|
|
|
|
|
| IPAIR | NAME | SHIFT | NEWSHIFT | S/N | NAME | SHIFT | NEWSHIFT | S/N |
| 0 | 18480024 | 0.505999 | 0.00000 | 19.6032 | 18480022 | 0.00000 | 0.505999 | 19.6987 |
| 1 | 18480023 | 0.504915 | 0.00108403 | 19.5090 | 18480025 | 0.00303907 | 0.502960 | 19.6670 |