| Red | Green | Blue | |
| z | 17.64 | ||
| znorm | Inf | ||
| sky | -Inf | -NaN | -NaN |
| S/N | 30.8 | 52.4 | 58.5 |
| S/N(c) | 18.9 | 87.1 | 99.3 |
| SN(E/C) |

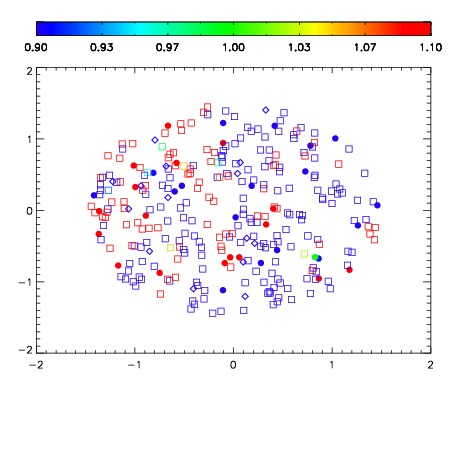
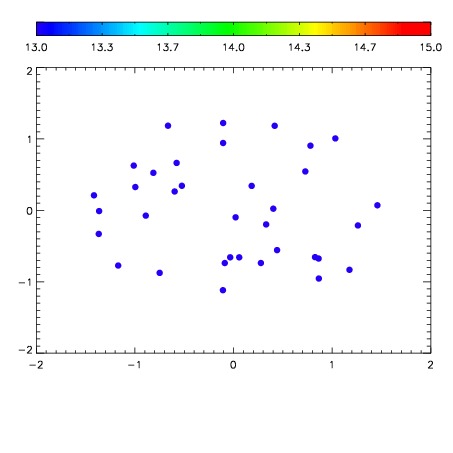

| Frame | Nreads | Zeropoints | Mag plots | Spatial mag deviation | Spatial sky 16325A emission deviations (filled: sky, open: star) | Spatial sky continuum emission | Spatial sky telluric CO2 absorption deviations (filled: H < 10) | |||||||||||||||||||||||
| 0 | 0 |
|
|
|
|
|
|
| IPAIR | NAME | SHIFT | NEWSHIFT | S/N | NAME | SHIFT | NEWSHIFT | S/N |
| 0 | 18530021 | 0.496059 | 0.00000 | 18.8489 | 18530014 | -0.00109799 | 0.497157 | 18.9250 |
| 1 | 18530012 | 0.494125 | 0.00193399 | 18.8841 | 18530022 | 0.00403451 | 0.492024 | 18.9825 |
| 2 | 18530017 | 0.495136 | 0.000923008 | 18.8098 | 18530011 | 0.00000 | 0.496059 | 18.9074 |
| 3 | 18530020 | 0.495080 | 0.000979006 | 18.8029 | 18530015 | -0.000913665 | 0.496973 | 18.8017 |
| 4 | 18530013 | 0.494198 | 0.00186101 | 18.7916 | 18530018 | 0.00132802 | 0.494731 | 18.7884 |
| 5 | 18530016 | 0.494885 | 0.00117400 | 18.7627 | 18530019 | 0.00189627 | 0.494163 | 18.7830 |