| Red | Green | Blue | |
| z | 17.64 | ||
| znorm | Inf | ||
| sky | -Inf | -NaN | -Inf |
| S/N | 32.3 | 55.5 | 63.3 |
| S/N(c) | 0.0 | 0.0 | 0.0 |
| SN(E/C) |
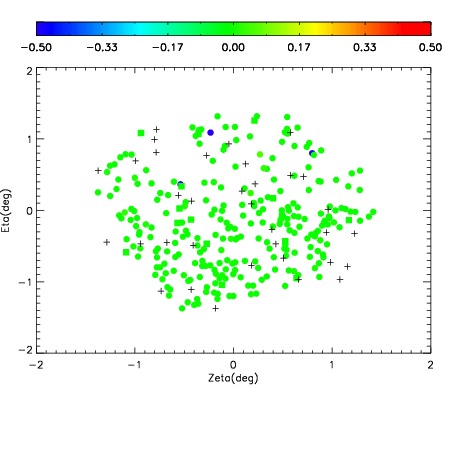
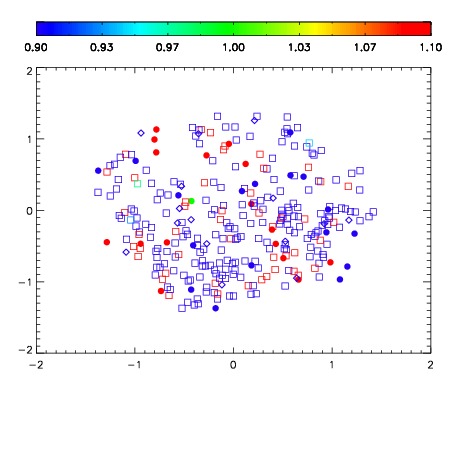
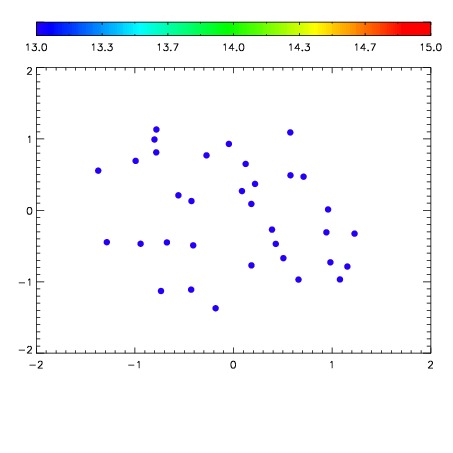

| Frame | Nreads | Zeropoints | Mag plots | Spatial mag deviation | Spatial sky 16325A emission deviations (filled: sky, open: star) | Spatial sky continuum emission | Spatial sky telluric CO2 absorption deviations (filled: H < 10) | |||||||||||||||||||||||
| 0 | 0 |
|
|
|
|
|
|
| IPAIR | NAME | SHIFT | NEWSHIFT | S/N | NAME | SHIFT | NEWSHIFT | S/N |
| 0 | 17860061 | 0.00152771 | 0.00000 | 18.9260 | 17860062 | -0.510846 | 0.512374 | 18.9515 |
| 1 | 17860060 | 0.000594720 | 0.000932990 | 18.9820 | 17860059 | -0.511358 | 0.512886 | 19.0340 |
| 2 | 17860057 | 0.00000 | 0.00152771 | 18.9738 | 17860058 | -0.512126 | 0.513654 | 19.0286 |
| 3 | 17860064 | 0.00118653 | 0.000341180 | 18.9702 | 17860063 | -0.511013 | 0.512541 | 18.9711 |