| Red | Green | Blue | |
| z | 17.63 | ||
| znorm | Inf | ||
| sky | -NaN | -NaN | -NaN |
| S/N | 29.8 | 47.1 | 59.3 |
| S/N(c) | 0.0 | 0.0 | 0.0 |
| SN(E/C) |
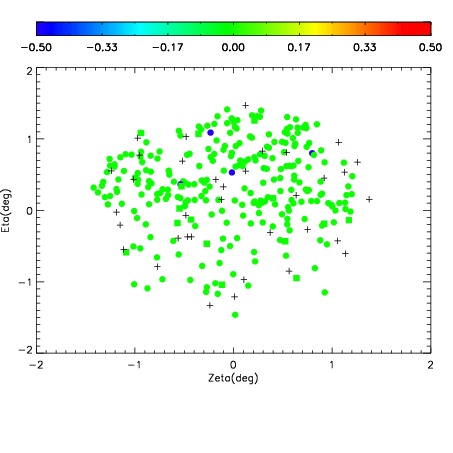

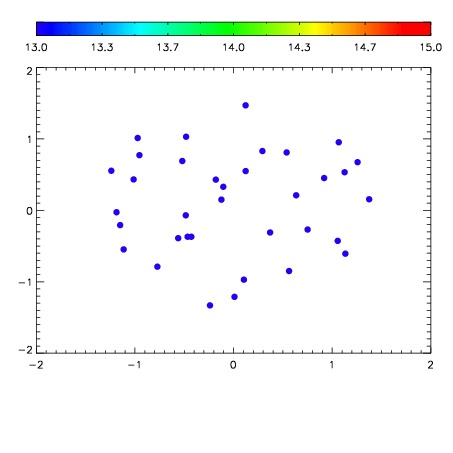

| Frame | Nreads | Zeropoints | Mag plots | Spatial mag deviation | Spatial sky 16325A emission deviations (filled: sky, open: star) | Spatial sky continuum emission | Spatial sky telluric CO2 absorption deviations (filled: H < 10) | |||||||||||||||||||||||
| 0 | 0 |
|
|
|
|
|
|
| IPAIR | NAME | SHIFT | NEWSHIFT | S/N | NAME | SHIFT | NEWSHIFT | S/N |
| 0 | 17950031 | 0.00165683 | 0.00000 | 18.9877 | 17950030 | -0.497346 | 0.499003 | 18.9433 |
| 1 | 17950028 | 0.000279001 | 0.00137783 | 19.0904 | 17950029 | -0.497032 | 0.498689 | 18.9593 |
| 2 | 17950027 | -0.000109077 | 0.00176591 | 19.0132 | 17950026 | -0.497804 | 0.499461 | 18.9439 |
| 3 | 17950024 | 0.00000 | 0.00165683 | 18.9345 | 17950025 | -0.498425 | 0.500082 | 18.6606 |